Ethereum Classic Technical Analysis: ETC/USD hampered by the upper curve of the 20-day Bollinger Band
- ETC/USD is trending in an upward channel formation.
- The RSI indicator has dropped down from the overbought zone.

ETC/USD daily chart
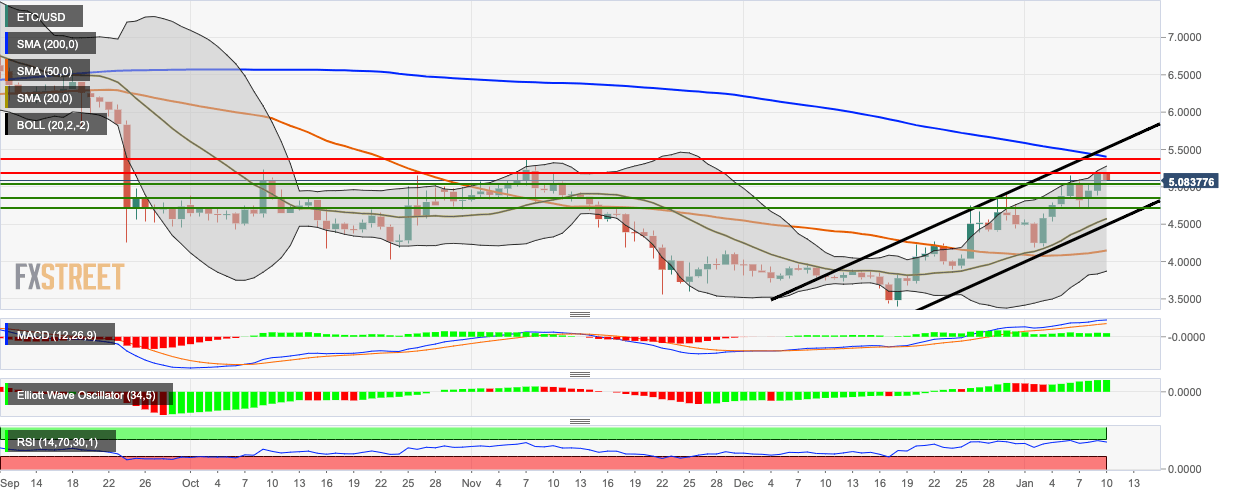
ETC/USD encountered resistance at the $5.20 line and the upper curve of the 20-day Bollinger Band and has fallen to $5.06, but it is still trending in an upwards channel formation. The Moving Average Convergence/Divergence indicates decreasing bullish momentum, while the Elliott Oscillator has had seven straight green sessions. The Relative Strength Index has bounced off the edge of the overbought zone and has dropped to 62.50, which shows that the bears have stepped in to correct a potentially overpriced market.
Author

Rajarshi Mitra
Independent Analyst
Rajarshi entered the blockchain space in 2016. He is a blockchain researcher who has worked for Blockgeeks and has done research work for several ICOs. He gets regularly invited to give talks on the blockchain technology and cryptocurrencies.


