Ethereum bulls come out to play while ETH price considers another 15% climb
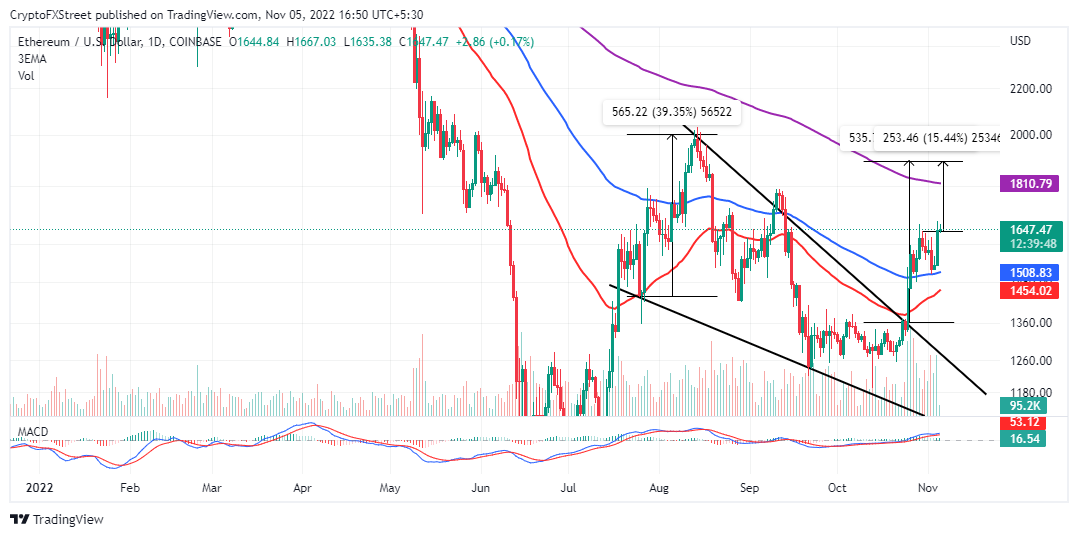
- Ethereum price is deliberating another 15% spike as part of a 39% falling wedge pattern breakout.
- Attackers of the Deribit hot wallet transferred 210 ETHs, according to transaction records on Etherscan.
- As support behind Ethereum steadies, weakening resistance areas could pave the way for gains to $1,897.

Ethereum price is slacking in its quest to return above $2,000. The largest smart contracts token teeters at $1,640 at the time of writing and in the wake of a short climb from support highlighted by the 100-day Exponential Moving Average at $1508.
Its technical outlook remains bullish despite the sluggishness experienced as it approached $1,700. A daily candlestick close above $1,600 will go a long way to affirm Ethereum's likely move to $1,897.
What'sWhat's holding Ethereum price bullish outlook intact?
Ethereum price started its quest for highs close to $2,000 after securing support at $1,260. A break out of a falling wedge pattern boosted the bulls' efforts, setting the course clear for a 39.35% move to $1,897.
With the general outlook in the market staying bullish this week, it has been easy for buyers to nurture a sudden rebound that saw ETH tag $1,676 – a weekly high on most exchanges. From the daily chart, Ethereum is more than halfway through its breakout target – having moved 23.91% to trade at $1,640.
The falling wedge is a bullish pattern that often marks the end of a downtrend or continuation of an uptrend. It has a precise breakout target of 39.35%, measured by the distance between the widest points of the wedge – extrapolated above ETH'sETH's breakout point.
ETH/USD daily chart
The Moving Average Convergence Divergence (MACD) indicator backs the bullish outlook in Ethereum price. The MACD validated a buy signal it gradually flashed in October by moving above the mean line. If the index's 12-day Exponential Moving Average (EMA) holds above the mean line, odds will be inclined to support ETH'sETH's bid for $1,897.
Fundamentals improve as Ethereum price uptrend steadies
According to Glassnode, the total exchange inflow volume has generally been upward since November 1. Approximately 360,000 ETH left exchanges compared to only 65,000 ETHs, as recorded on October 8.
This on-chain metric exhibits increased investor optimism. Holders tend to move their assets out of exchanges when they intend to HOLDL, a term used to mean holding assets for a longer period. This exodus of ETH from exchanges indirectly reduces selling pressure, thus paving the way for a sustained price movement to the upside.
-638032451044542955.png)
Ethereum Exchange Outflow Volume
For now, the path with the least resistance is to the upside, but bulls must confirm a daily close above $1,600. Moreover, trading above the stubborn resistance at $1,700 could quicken the move to $1,897. On the downside, short positions could flip profitable if Ethereum price slides below the 100-day (EMA) (in blue) for possible targets at the 50-day SMA and support at $1,360.
-638032450893545031.png)
Etherscan transaction records
In other news, the Deribit hot wallet's attackers transferred part of the stolen funds to Tornado Cash on Saturday. According to Etherscan, 210 ETHs were moved in three transactions. The attackers still possess 8,901 ETHs, while all the stolen Bitcoin (BTC) is yet to be transferred.
Author

John Isige
FXStreet
John Isige is a seasoned cryptocurrency journalist and markets analyst committed to delivering high-quality, actionable insights tailored to traders, investors, and crypto enthusiasts. He enjoys deep dives into emerging Web3 tren


