Ethena Price Forecast: ENA flips bearish as DeFi TVL, Open Interest decline
- Ethena falls below $0.5000 psychological level, risking Sunday's gains.
- Declining ENA futures Open Interest suggests that traders are limiting their exposure.
- Ethena’s DeFi TVL shows a sustained drop in on-chain demand.

Ethena (ENA) is down nearly 2% at press time on Tuesday, extending this week's loss to almost 5%. A decline in both on-chain and retail demand could result in further losses for the synthetic Dollar token.
Ethena suffers from lower demand as the market becomes risk-averse
Ethena’s Total Value Locked (TVL) has continued to decrease since the October 10 crash, as users withdraw or redeem contracts. DeFiLlama data shows that the Decentralized Finance (DeFi) protocol’s TVL is at $10.206 billion, down from $14.818 billion on October 10. A sustained capital outflow from Ethena risks tighter liquidity and lower fees, which could further depress demand for ENA.
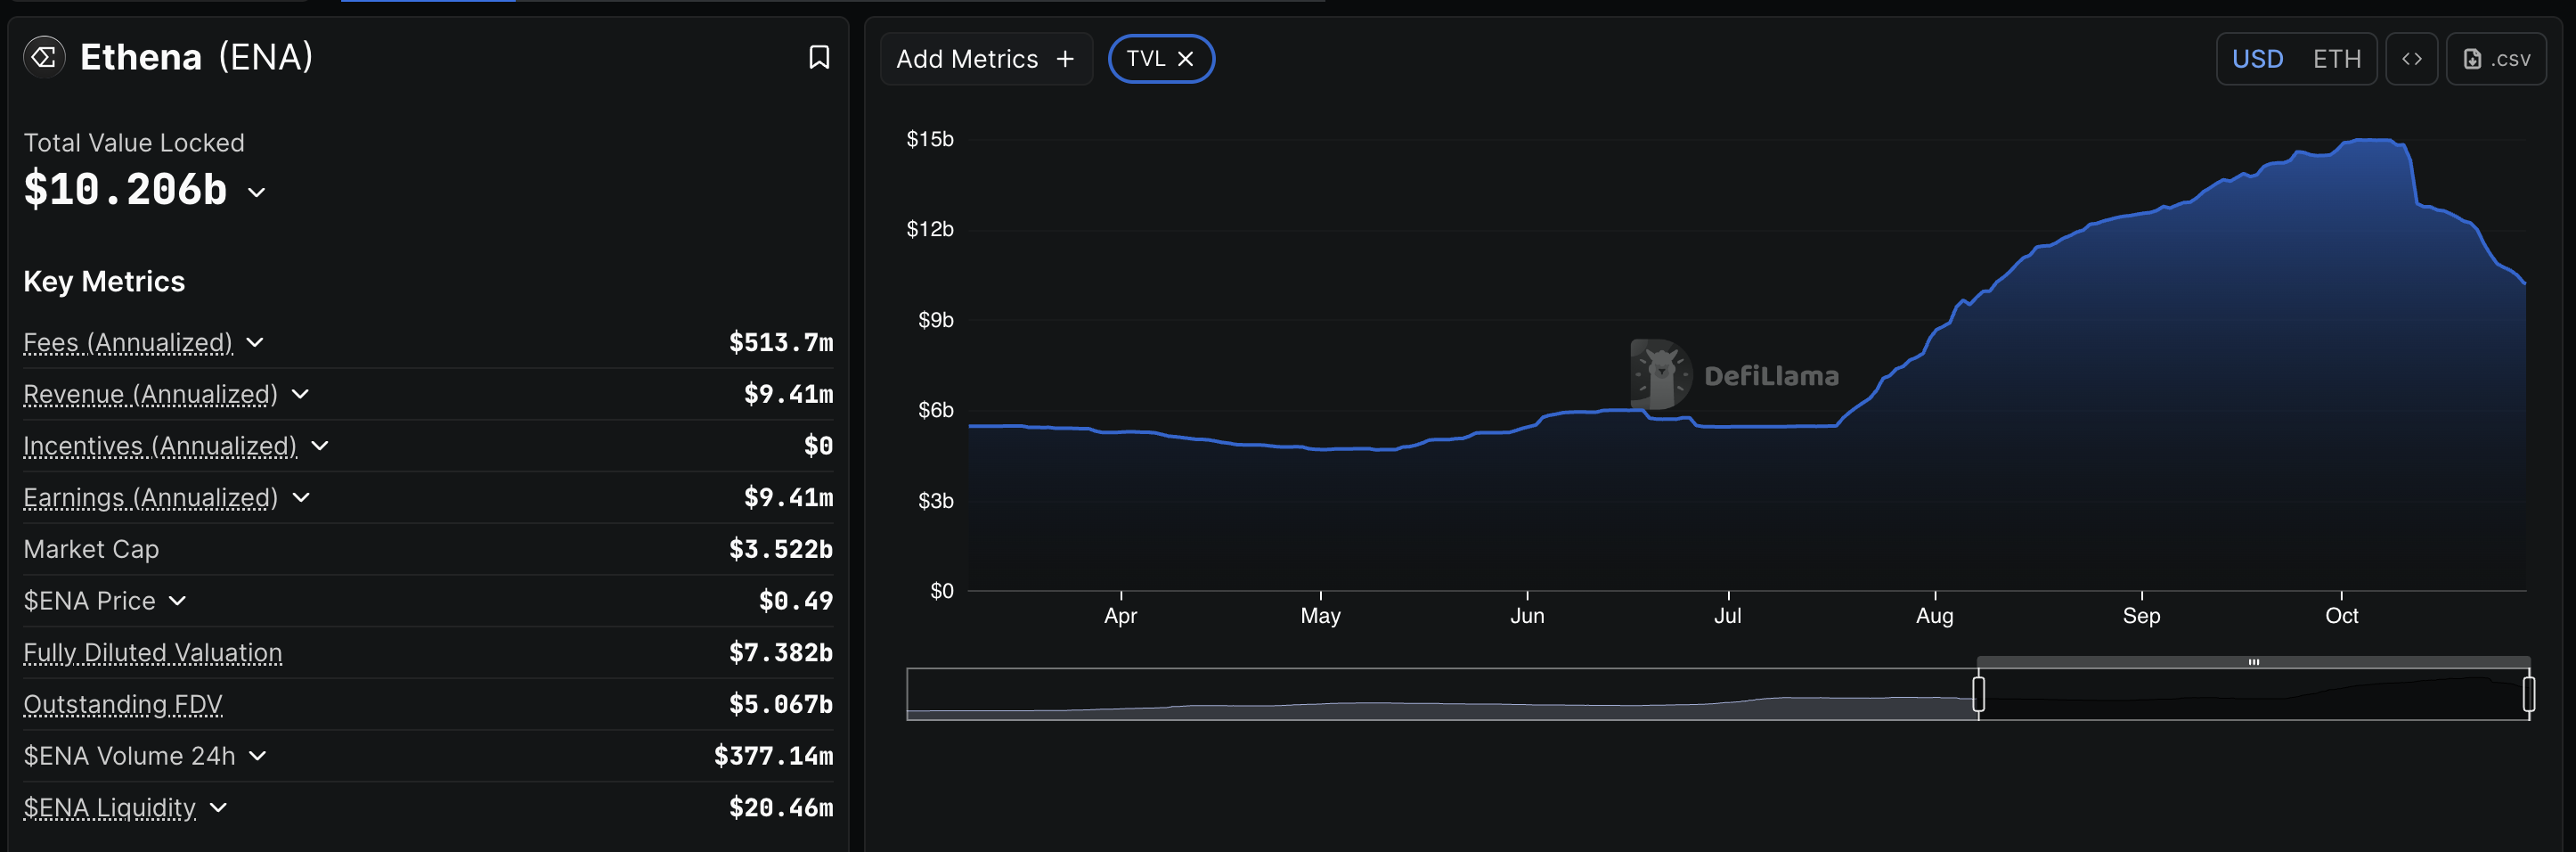
Ethena's DeFi TVL. Source: DeFiLlama
In line with the on-chain slump, retail demand for Ethena remains low. CoinGlass data shows that the ENA futures Open Interest (OI), which represents the notional value of all outstanding contracts, is down 8.65% over the last 24 hours to $727.49 million. This indicates that derivative traders are limiting their risk exposure.
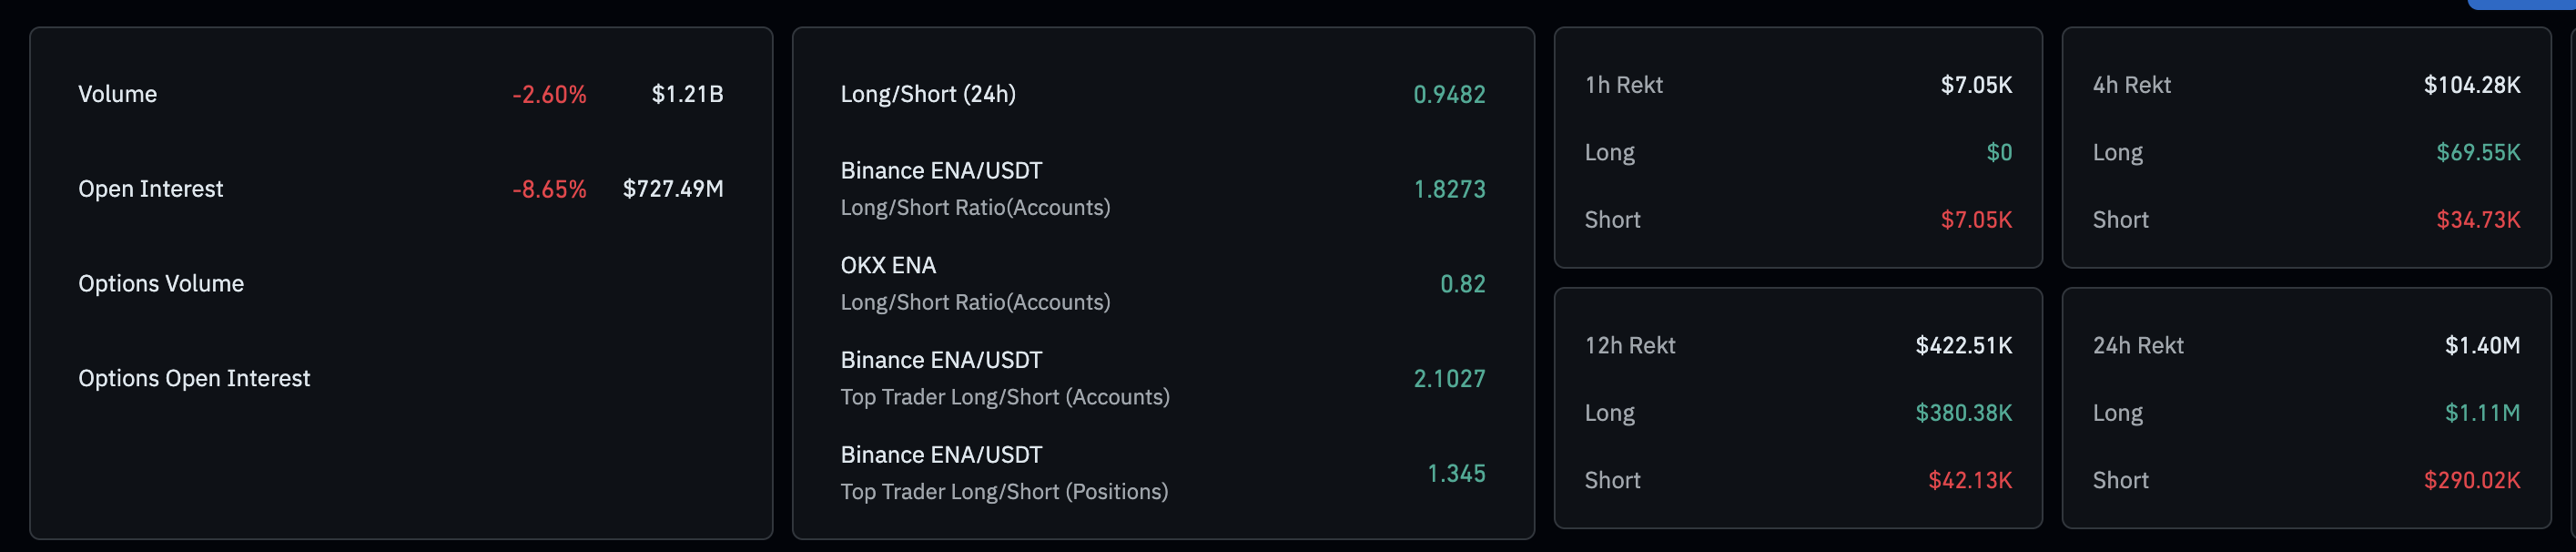
Ethena derivatives data. Source: CoinGlass
Technical outlook: Will Ethena extend the downtrend to $0.4500?
Ethena extends the reversal from the $0.5343 resistance level, which previously served as support in early October. At the time of writing, ENA trades below the $0.5000 psychological level, approaching a local support trendline formed by connecting the October 12 and October 23 lows, slightly above $0.4600.
If the decline continues, Ethena risks breaking below the trendline to test the S1 Pivot Point at $0.4459.
Ethena’s trend momentum shifts bearish as the downward trend gains traction. The Moving Average Convergence Divergence (MACD) on the 4-hour chart crosses below its signal line on Tuesday, indicating renewed selling pressure.
Additionally, the Relative Strength Index (RSI) on the same chart declines to 53, approaching the midline and indicating a loss of buying pressure.
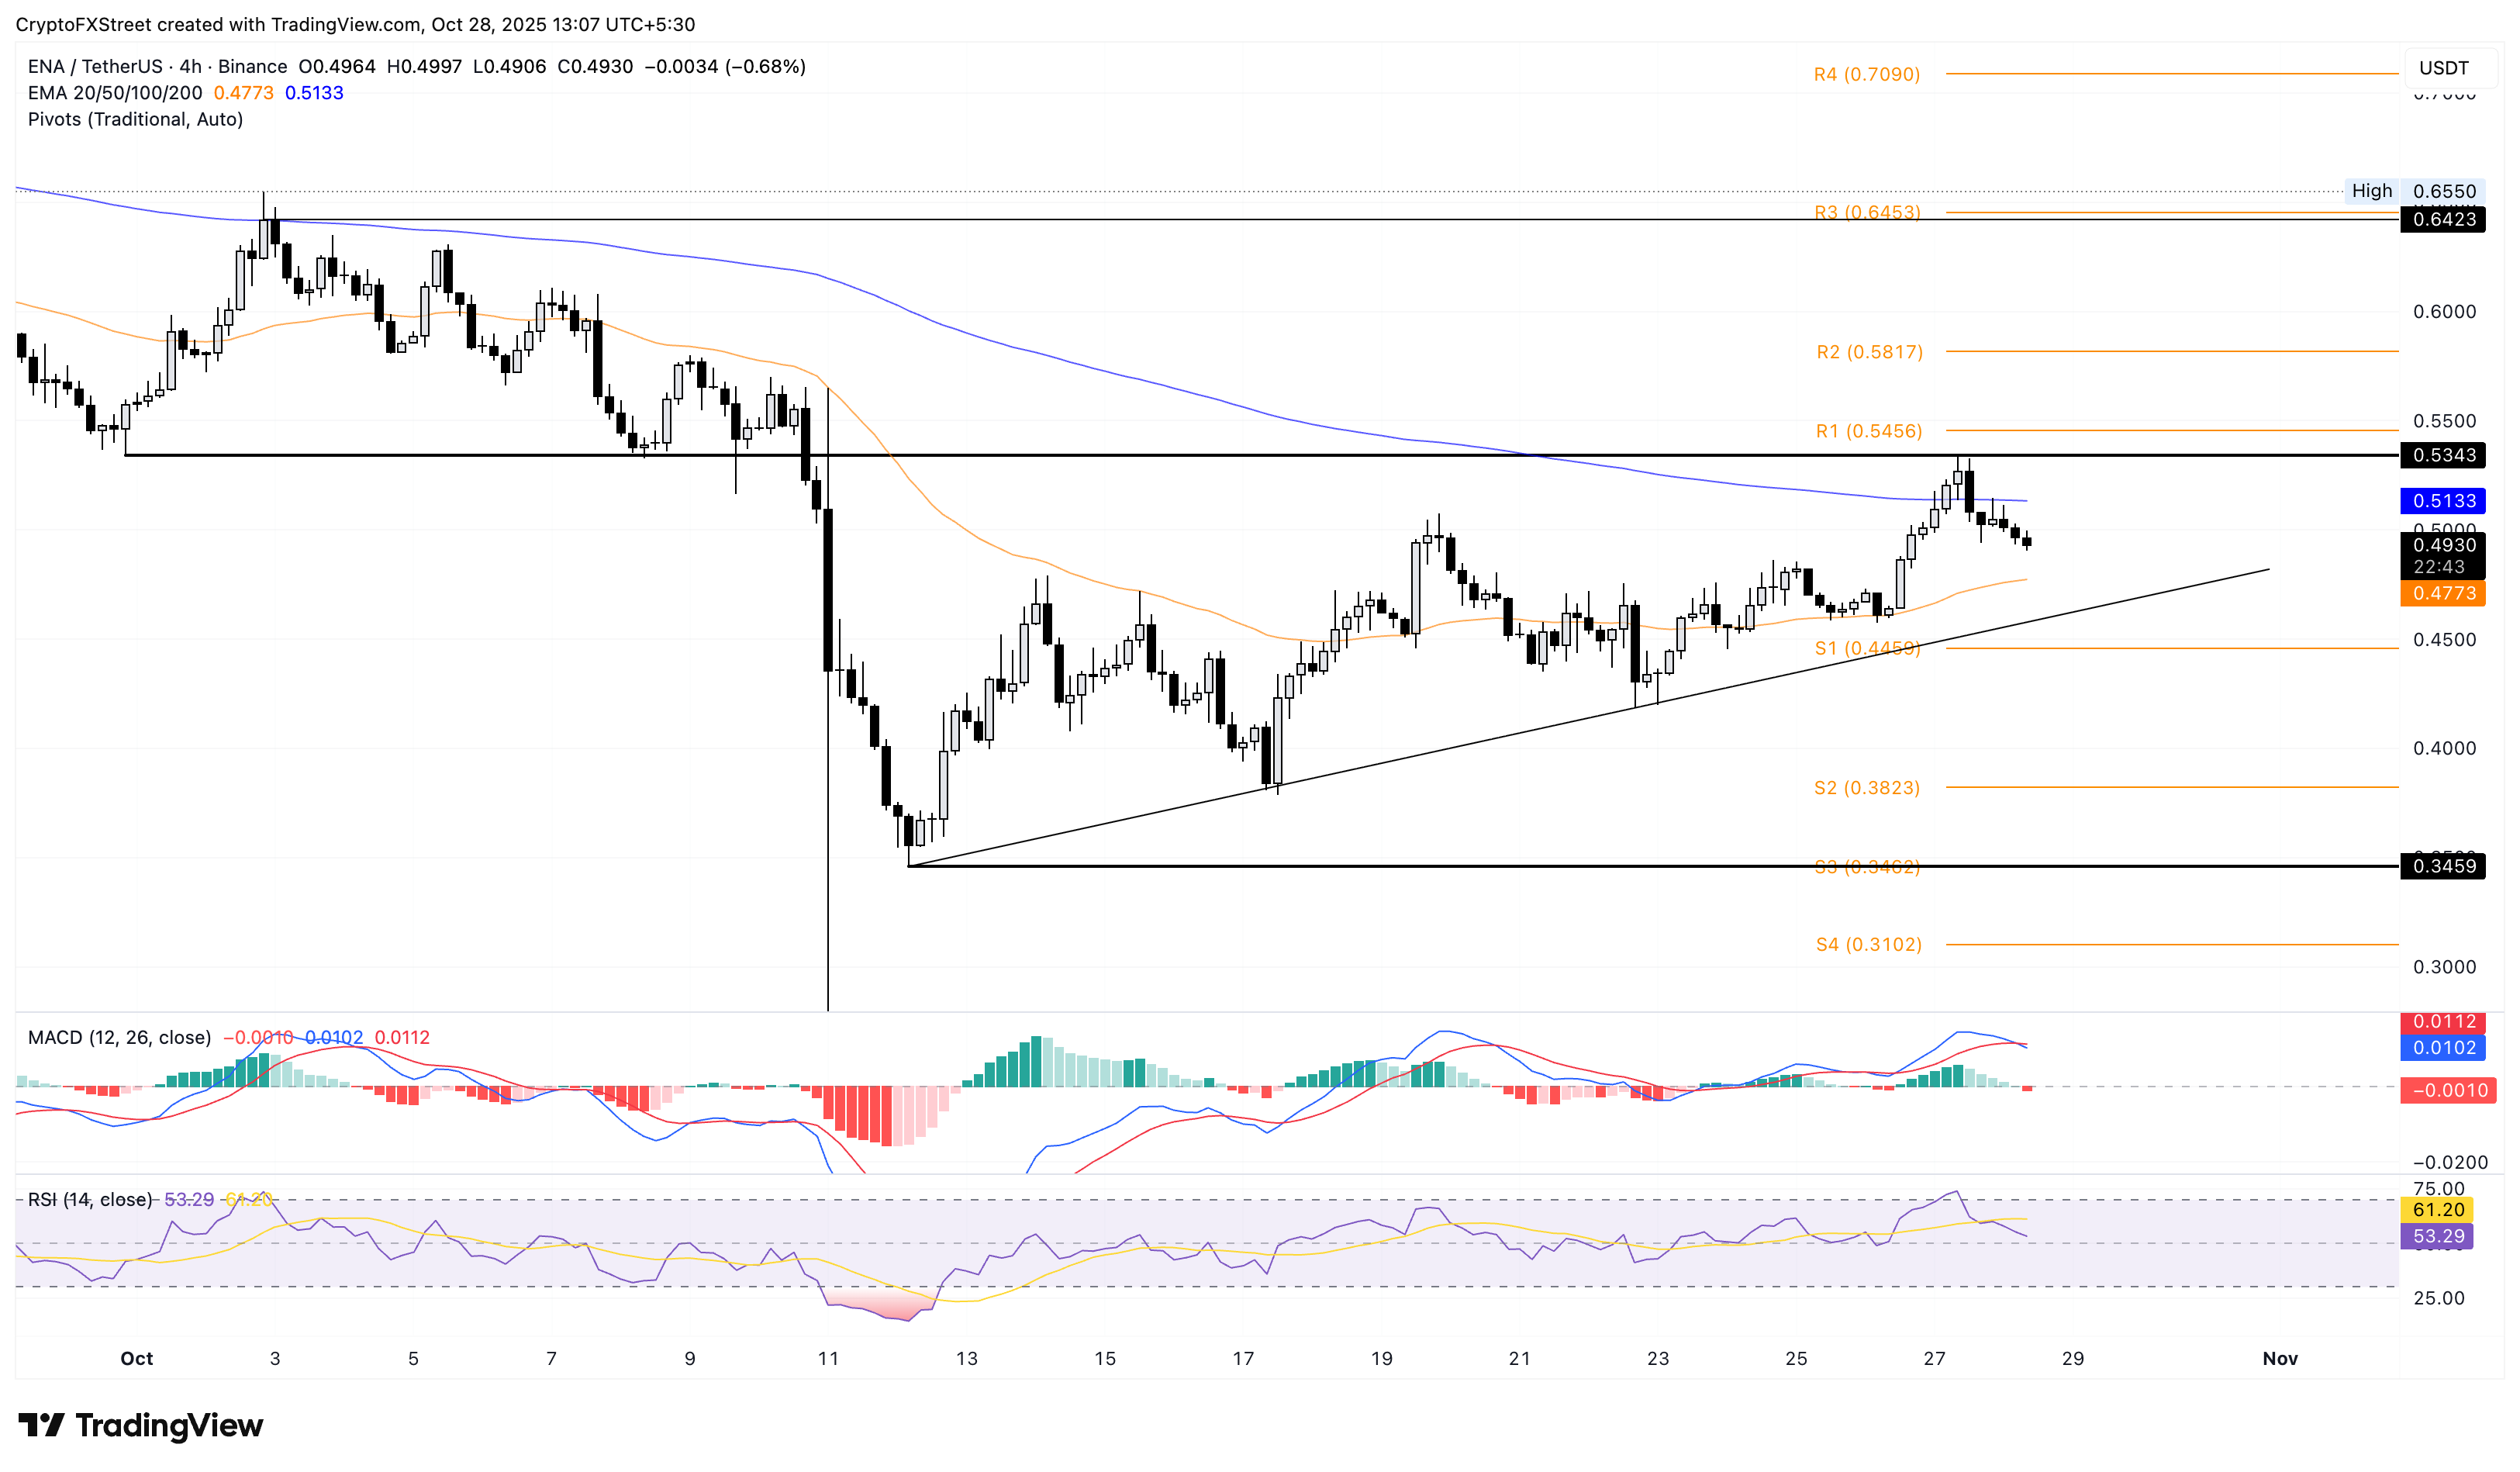
ENA/USDT daily price chart.
Looking up, if Ethena rebounds above $0.5000 level, it should close above $0.5343 to ensure a steady upward trend. Key resistance levels for the potential ENA breakout rally are the R2 and R3 Pivot Points at $0.5817 and $0.6453, respectively.
Author

Vishal Dixit
FXStreet
Vishal Dixit holds a B.Sc. in Chemistry from Wilson College but found his true calling in the world of crypto.



