ETH/USD technical analysis: The overall sentiment for Ethereum is bearish

Since the start of the year, the price of Ethereum has been increasing and came up from $137 (the lowest point on January 1st) to $166 (the highest point so far) on Saturday. Then the high price has pulled back and the pair is currently trading at $156.13 on FXOpen with an overall increase of around 14%.
On the hourly chart, the price action has created a rising wedge, that's why a breakout to the downside would be expected from here. This is also validated by the Elliott Wave count. The current correction looks like it is going to end on the wedge resistance line, so the start of the next structure would lead to a breakout on the downside.
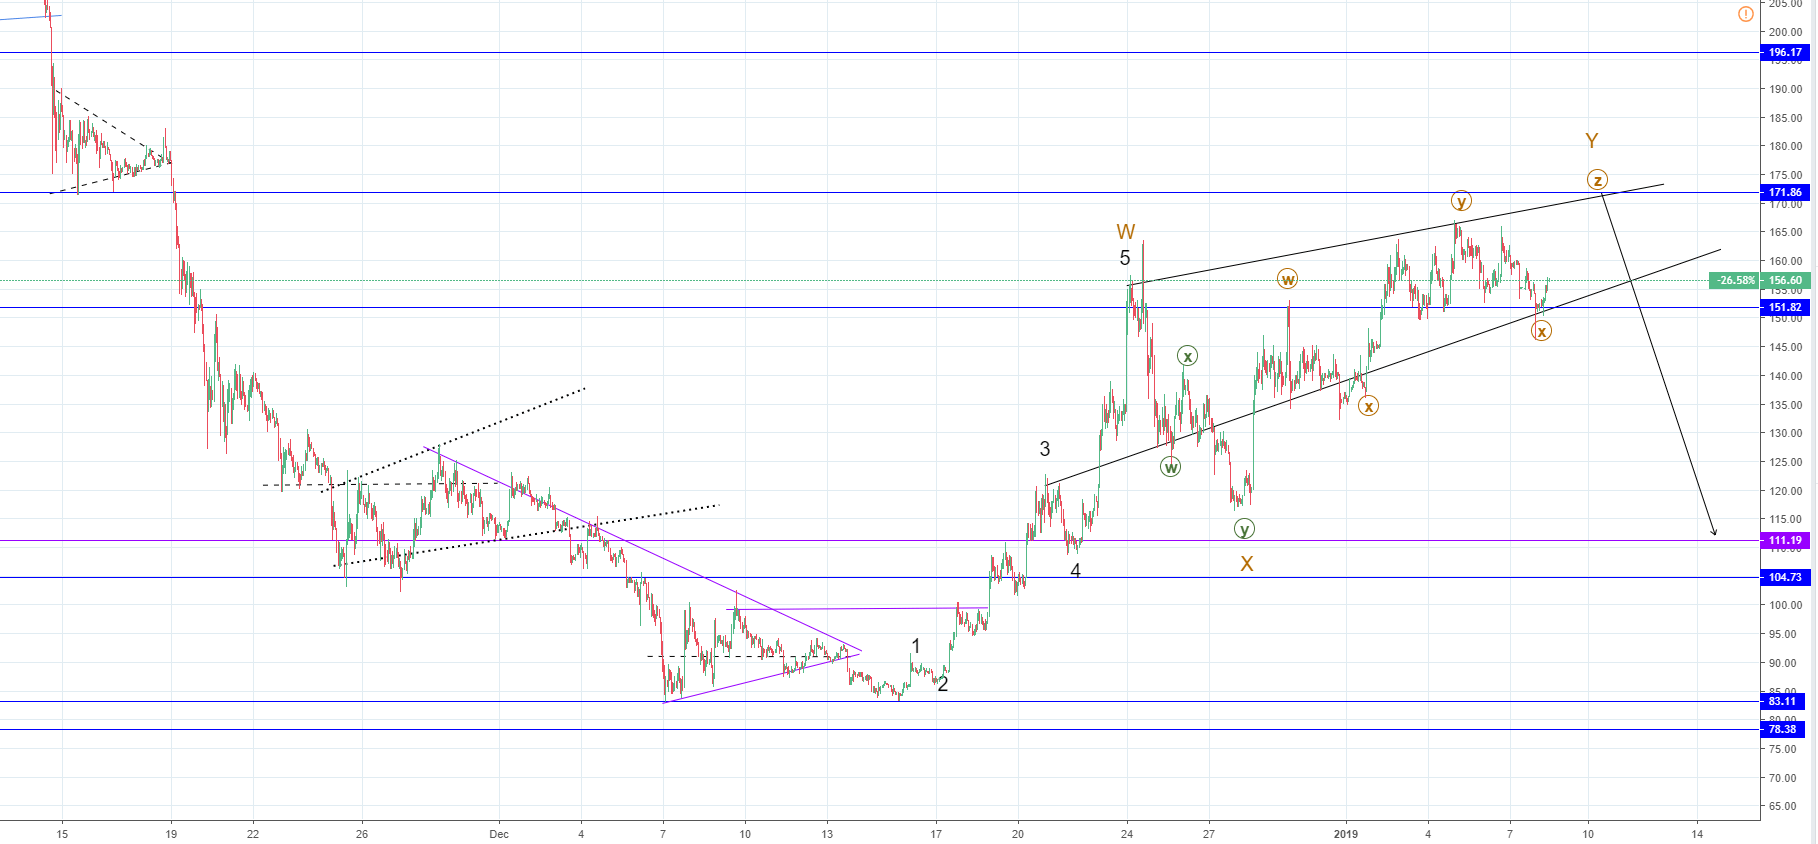
The price target for that breakout would depend on the completion of the Z wave. But as we expect it to end on a higher high at around $171, we are likely going to see further downside and new lows for the ETH price. This minor WXYXZ correction would be the final Y wave from a WXY from a higher degree.
The price will at least go to around $112 level as that would be a 60-70% retracement from the expected ending point of the wedge or where the projected Z wave is.
After the move to the upside ends, we are most likely going to see lower lows than the previous one at $83.
The current WXY correction might get prolonged by two more waves, so the ETH/USD price could go much higher before this expected down move begins. In either way, the overall sentiment is still bearish.
Author

FXOpen Broker Team
FXOpen


