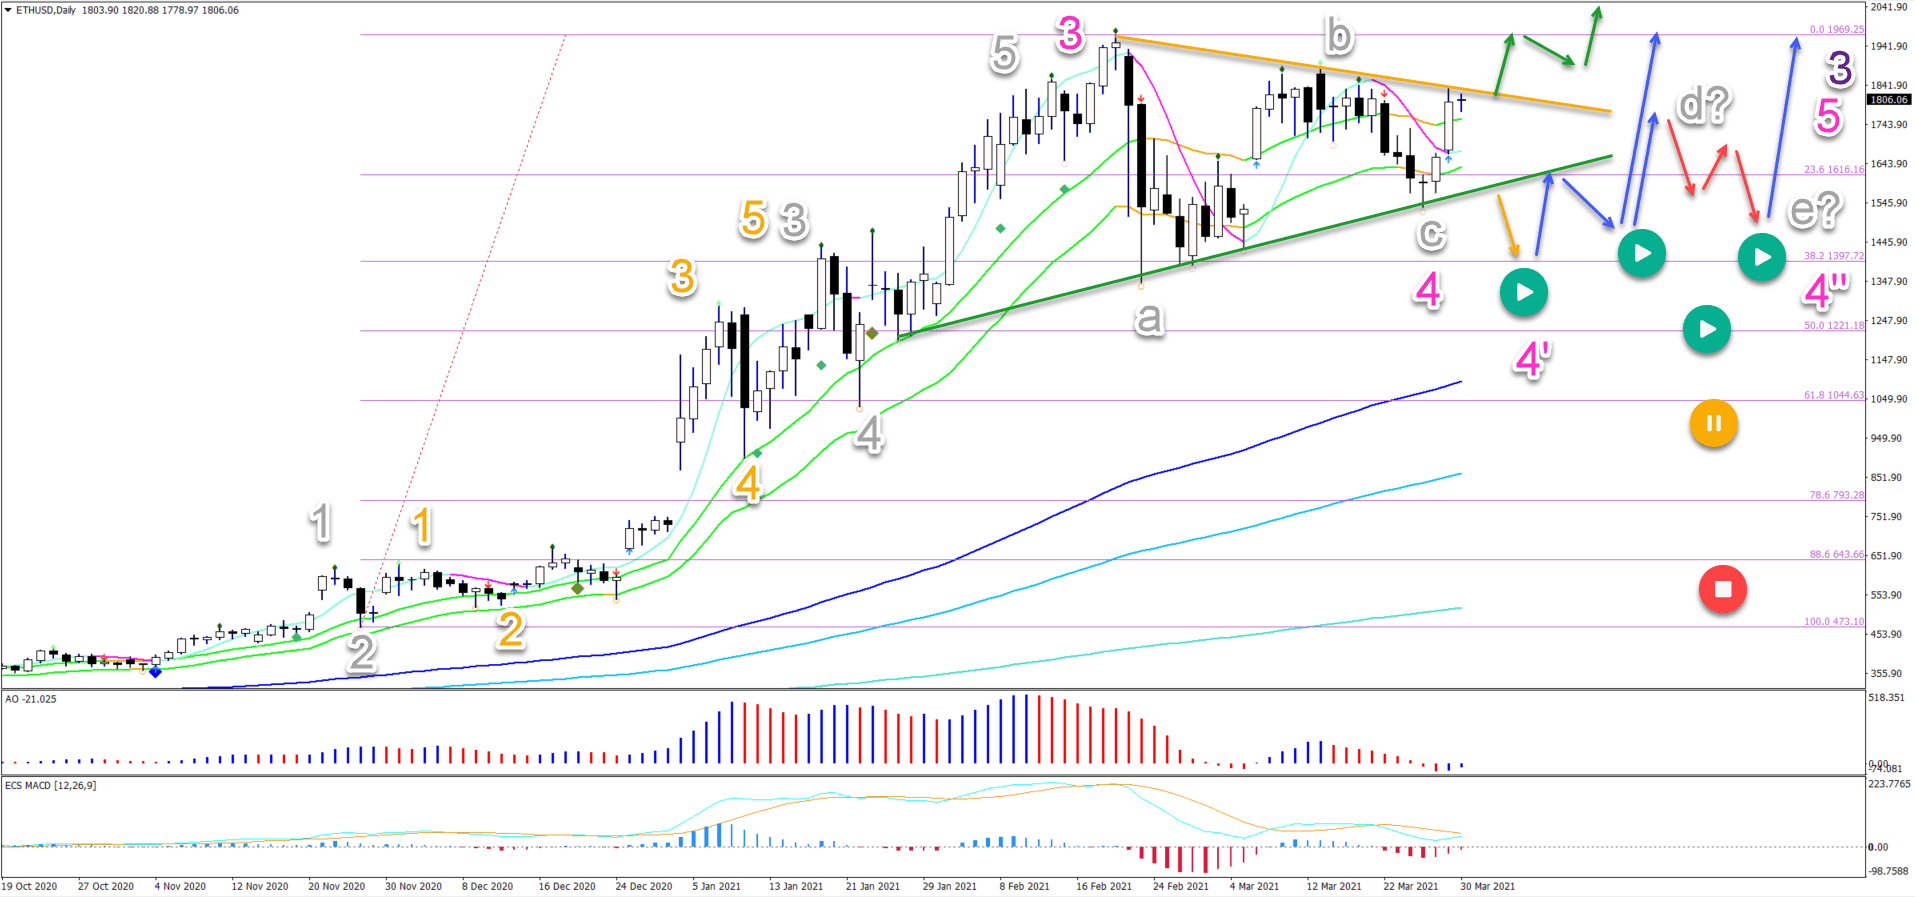
ETH/USD strong bullish momentum after ABC correction in wave 4
-
Ethereum (ETH/USD) cryptocurrency made a bearish ABC correction (grey). This occurred after completing a strong surge higher within a wave 3 (pink).
-
The ETH/USD daily chart is showing that the expected ABC pattern (grey) did indeed play out after price action made a bullish bounce at the 38.2% Fibonacci retracement level.
-
The recent and current surge up (light blue arrows) is very strong. This indicates a wave 3, which means that a bullish breakout (green arrows) has the best probability.

Yesterday Bitcoin, the cryptocurrency market in general, and especially ETH/USD made a strong impulsive move up. The news that Visa is planning to allow payment settlements using cryptocurrency, which will use the ethereum blockchain.
Price charts and technical analysis
The ETH/USD daily chart is showing that the expected ABC pattern (grey) did indeed play out after price action made a bullish bounce at the 38.2% Fibonacci retracement level. Let’s review what traders might expect next:
-
The resistance trend line (orange) is critical for the next step. A bullish breakout (green arrows) indicates an immediate uptrend, the end of wave 4 (pink) and the start of wave 5 (pink).
-
A bearish breakout (orange arrows) below support (green line) indicates a deeper or longer retracement. In that case, an ABCDE triangle chart pattern is the most likely chart pattern. Later on, we expect wave E to finish and then wave 5 (pink) to start.
-
The next targets are located at $2,000, $2,150, $2,500, and then $2700.
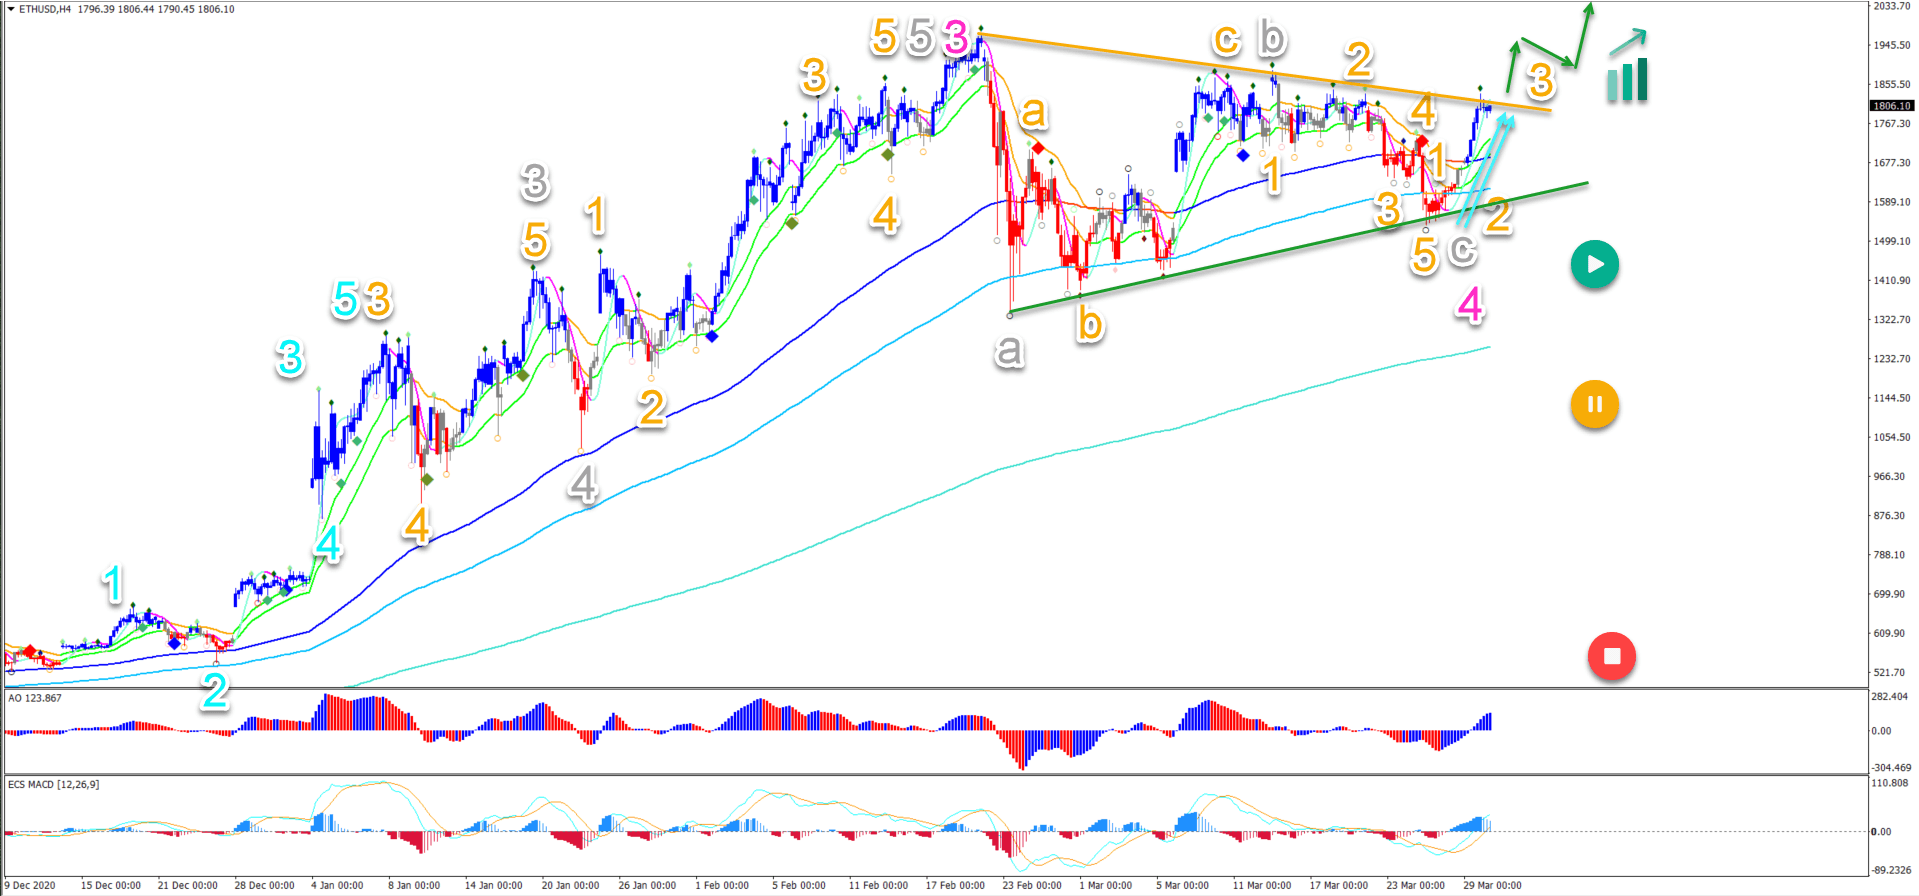
On the 4 hour chart, price action has been testing the 144-233 long-term moving average for the first time since December 2020. Let’s analyse this chart:
-
A bearish ABC pattern (grey) took place after a strong wave 3 (pink).
-
The long-term MAs have stopped price from falling down lower, which created a shallow and sideways correction in wave 4 (pink).
-
The recent and current surge up (light blue arrows) is very strong. This indicates a wave 3, which means that a bullish breakout (green arrows) has the best probability. This is probably an ongoing wave 3 (orange).
-
Only very deep and unlikely retracements (yellow/red circles) place the uptrend in danger.
The analysis has been done with the ecs.SWAT method and ebook.
Author

Chris Svorcik
FS method
Chris Svorcik is a trader, analyst, and educator with over 15 years of experience in financial markets, specializing in moving averages, market structure, and price patterns.


