ETH/USD outlook: the pair in a correctional move

Since last week, when the price of Ethereum was $142.34 on Tuesday, the price has decreased by 11% at first measured to the lowest point the price has been yesterday at $126.6. But since then the price started increasing again and is currently sitting at around $137 on FXOpen UK.
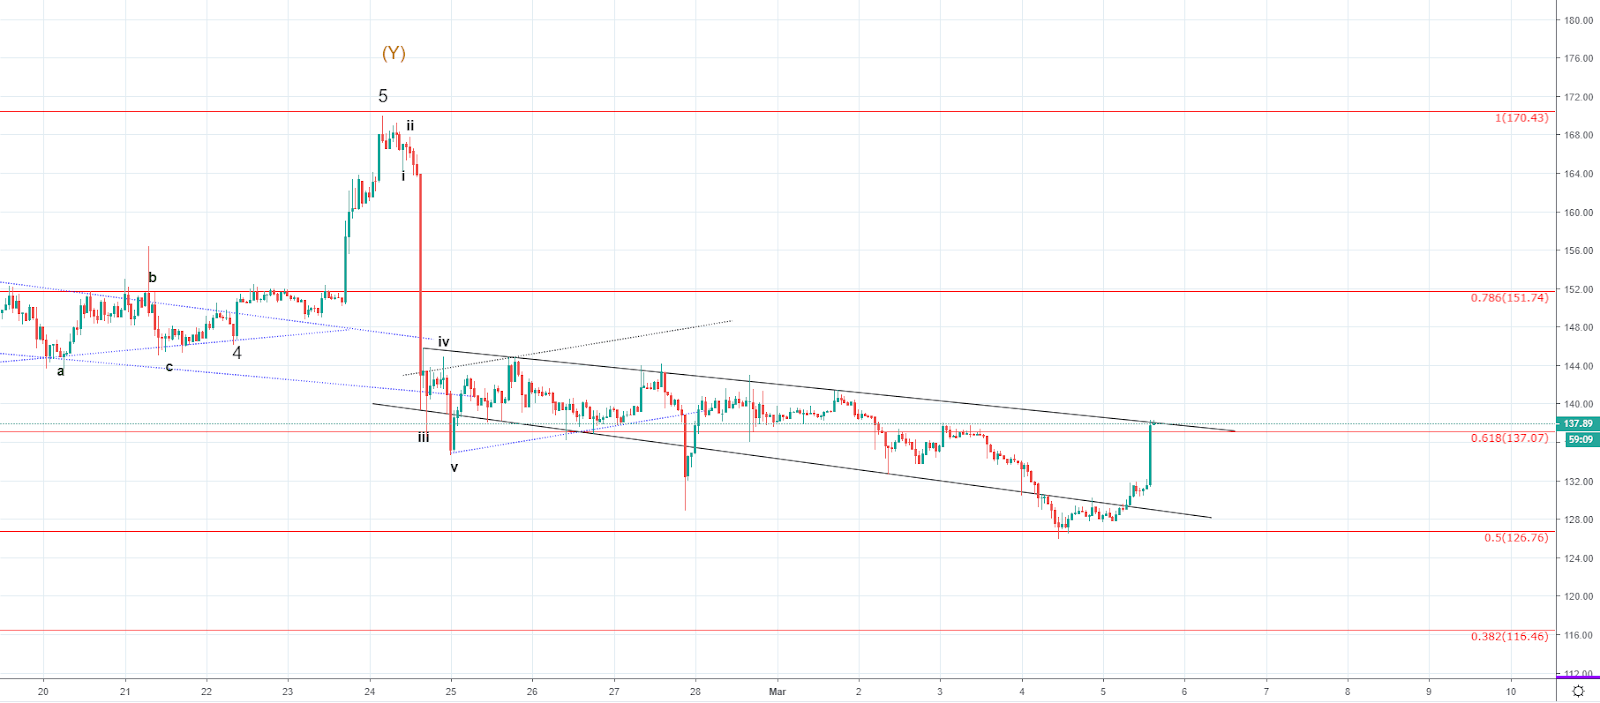
Looking at the hourly chart, we can see that the price of Ethereum was in a descending channel after the initial drop and has been moving sideways until yesterday when it came down to the 0.5 Fibonacci level where it found support. Today the price started increasing again and came back inside the territory of the descending channel and is currently interacting with its resistance level.
As I believe, this move was correctional because previous to the formation of the descending channel the price dropped impulsively to the downside. We are now most likely to see a rejection at the current level before further downside movement.
The price is above the 0.618 Fibonacci level which could serve as support so the price could increase further from here but only by a small amount potentially ending as a fakeout on a higher time frame.
If we see the price continues moving further up the next significant resistance point would be at around $144, where the horizontal resistance from the first two highs inside the descending channel is. But I don’t believe that the price is heading further up as both descending channels resistance and the 0.618 Fibonacci level resistance are stronger than the current momentum.
Author

FXOpen Broker Team
FXOpen


