EOS/USD technical analysis: The price has respected a good technical support level
- Like most of the crypto pairs EOS/USD is trading lower today by 2.16%.
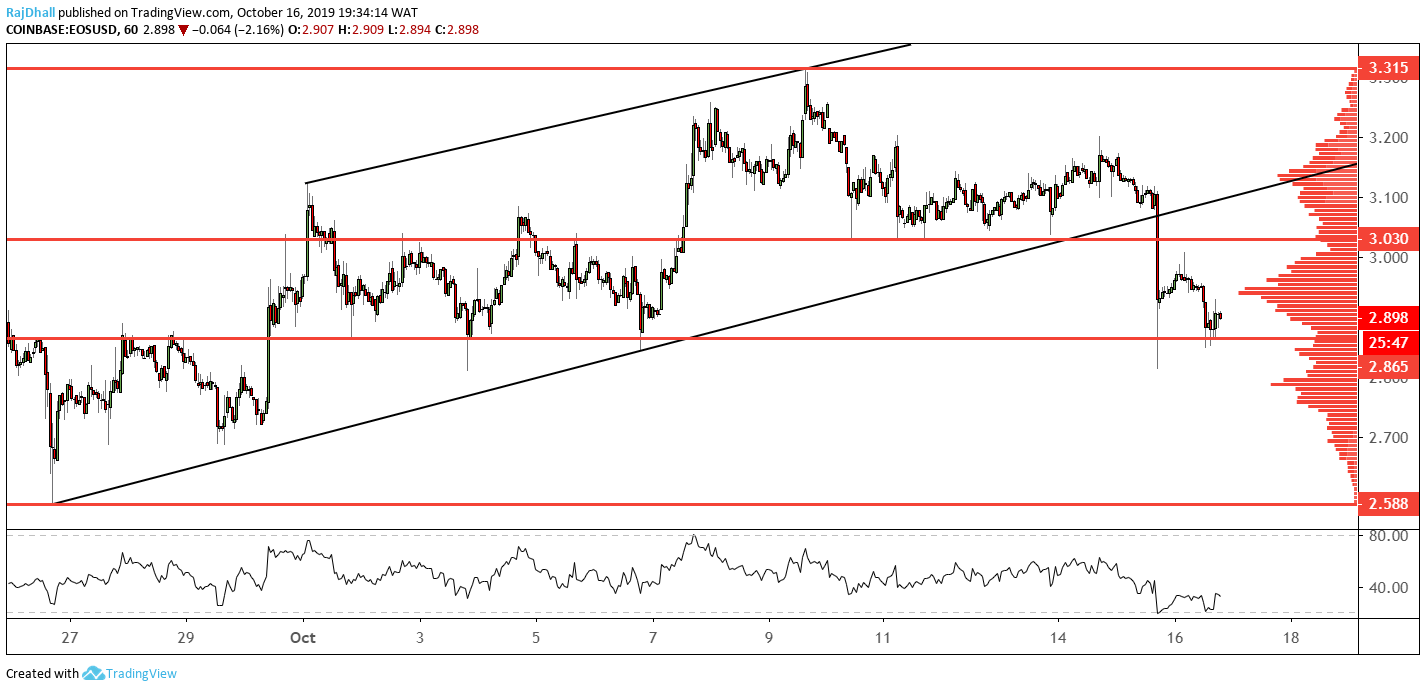
- The market has found some support at a previous touted support zone at 2.898.

After the market broken lower from the channel pattern and pushed through the 3.000 psychological support zone.
Now the 2.898 level has been used as a great support zone on the hourly chart. That is not to say it wont be broken later on but it is just holding for now.
Looking at he volume profile indicator on the right-hand side of the chart the price is just currently below the mean value area which is the peak of the bell curve in the current distribution.
The relative strength index (RSI) indicator is also showing a sign of some lost momentum in the sell of as the indicator made a higher low and the price made a higher low.
On the topside, there could be two resistance points. One is at the bottom of the channel and the other is the 3.030 support level that was broken, which could now become resistance.
On the downside the 2.588 is the total low on the Coinbase exchange and if its broken we are basically into the abyss. Having said that we are pretty far off at this point.
Author

Rajan Dhall, MSTA
FX Daily
Rajan Dhall is an experienced market analyst, who has been trading professionally since 2007 managing various funds producing exceptional returns.


