EOS price analysis: EOS/USD trending in an upwards channel formation
- EOS/USD went up from $4.15 to $4.46 this Wednesday.
- Technical analysis shows that market momentum has shifted from bearish to bullish.

EOS/USD has had a bullish Wednesday, as the price went up from $4.15 to $4.46, charting a 7.47% increase in valuation. In the process, EOS/USD managed to have two bullish days in a row. Plus, four out of the last five sessions in the EOS/USD daily price chart were bullish. The hourly price chart shows that the price shot up from $4.23 to $4.63 in just two hours, where it met resistance and then fell to $4.37. After that, the bulls managed to pick the price up to $4.46.
EOS/USD daily chart
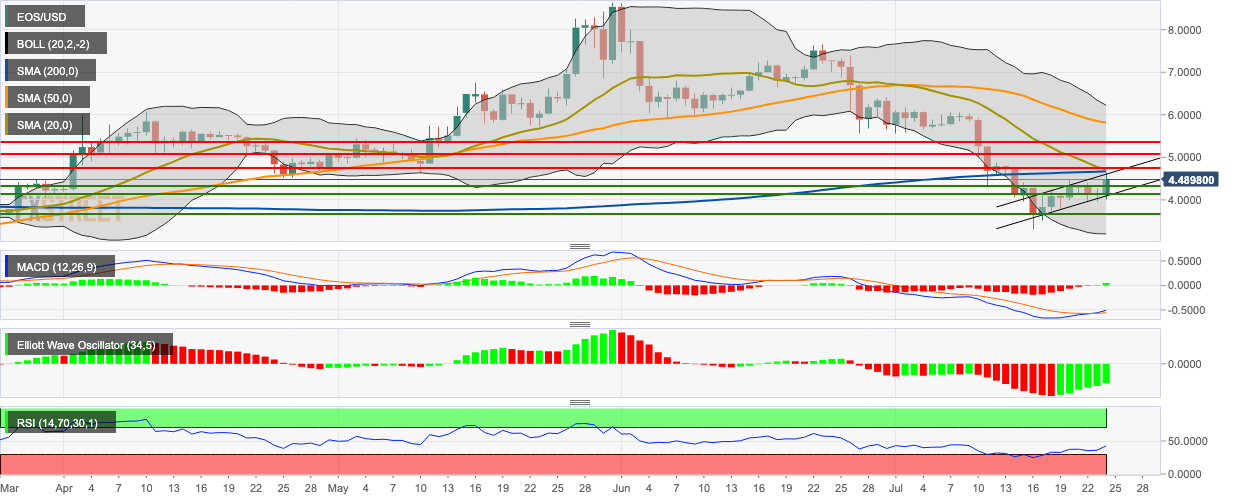
The eight latest sessions are trending in an upward channel formation. The daily price is trending below the 200-day simple moving average (SMA 200), SMA 50 and SMA 20 curves. The SMA 200 is looking to cross over the SMA 20 curve, which is a bearish sign. This Wednesday, the price managed to break past the resistance at $4.32.
The signal line has crossed over the moving average convergence/divergence (MACD) line, showing that market momentum has changed from bearish to bullish. The Elliot oscillator shows six straight bullish sessions with increasing intensity. The relative strength index was in the oversold zone, but it is now trending around 43.75.
Author

Rajarshi Mitra
Independent Analyst
Rajarshi entered the blockchain space in 2016. He is a blockchain researcher who has worked for Blockgeeks and has done research work for several ICOs. He gets regularly invited to give talks on the blockchain technology and cryptocurrencies.


