Enjin Coin Price Prediction: ENJ may rally 15% if it can defeat critical resistance
- Enjin Coin price is struggling with short-term resistance established by the June 8 low.
- Bearish Death Cross pattern nearing completion as 50-day simple moving average (SMA) approaches 200-day SMA.
- ENJ declining trend line from the April high will be a disincentive for the rally to evolve from a corrective bounce to a new uptrend.

Enjin Coin price is being rejected at a minor resistance level today as the cryptocurrency complex gets a bid, raising hopes that June 22 was the final low for the major correction. The failure at the minor resistance suggests the ENJ interest is weak, and it will be challenging to engineer a rally to the 200-day SMA or beyond, thus leaving upside opportunity limited in the short term.
Enjin Coin price needs momentum, or it could lead to disaster
Enjin Coin price correction during April-May bottomed below the 78.6% retracement of the 2021 advance, generating an 80% decline at the May 23 low of $0.72. It was and remains a substantial blow to the blockchain-based gaming ecosystem as ENJ struggles to generate some form of price traction that can carry it above minor and significant resistance levels that are layered on the daily chart.
Today and on June 25, Enjin Coin price attempted to overcome the June 8 low of $1.14, but on both occasions, it failed. If this level is proving to be a challenge, it does not raise the confidence that ENJ can challenge the more substantive technical levels on the charts.
A successful close above $1.14 will improve the short-term outlook for Enjin Coin price, putting the 200-day SMA at $1.31 in the crosshairs, as well as the April declining trend line and the 50-day SMA at $1.42. If ENJ does strike the 50-day SMA, it would be a 25% gain based on the current placement of the moving average
Enjin Coin price will struggle to extend the rally as the daily Ichimoku Cloud hovers above the mentioned levels. As well, the approaching Death Cross, when the 50-day SMA crosses below the 200-day SMA, is close to triggering, adding more downside pressure on ENJ.
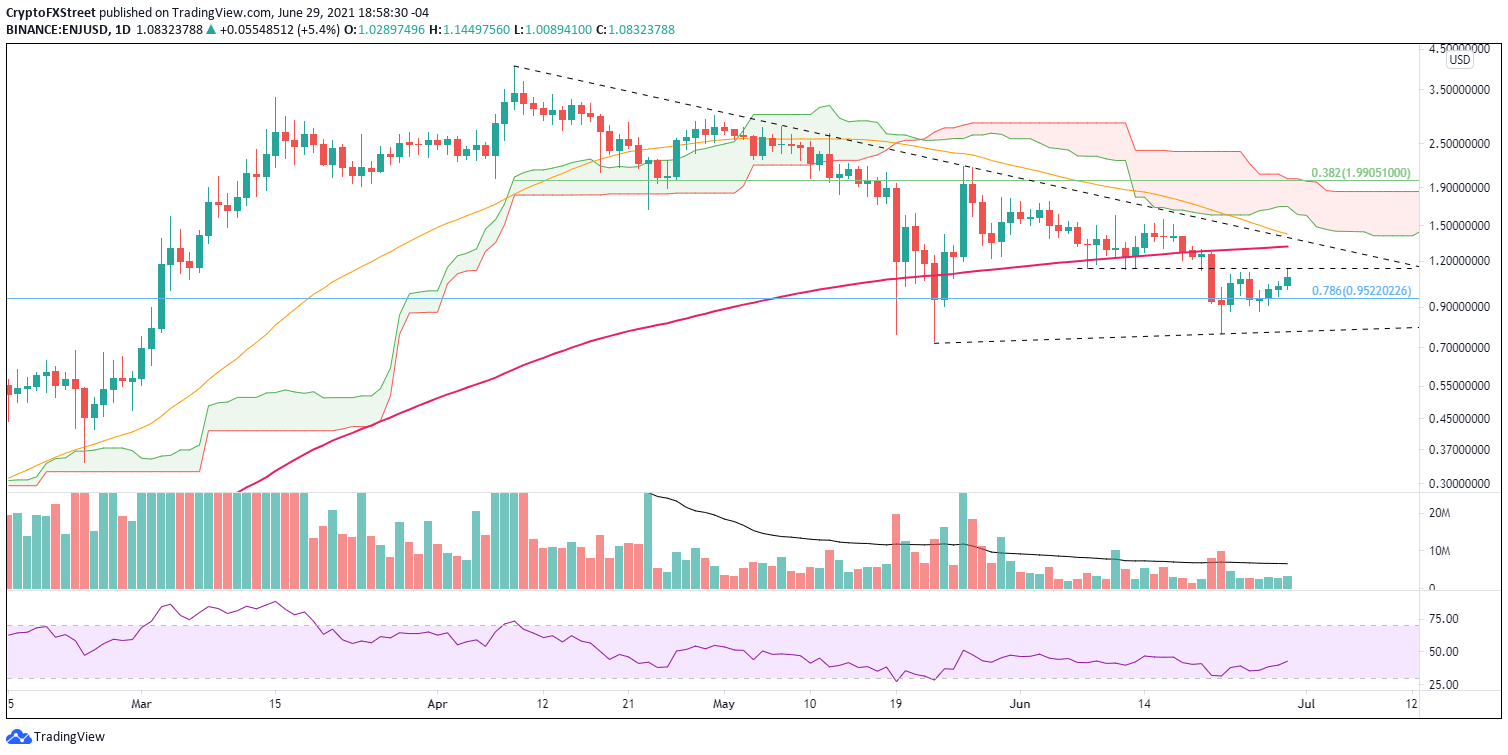
ENJ/USD daily chart
Based on the current price action, ENJ investors should consider the possibility that Enjin Coin price is forming the second high of a minor double top pattern. A trade below the double top trigger at $0.87 would be the first confirmation that the corrective rebound is complete and Enjin Coin price is readying to revisit the June 22 low of $0.76. A failure to hold the June 22 low will encourage a sweep of the May 23 low of $0.72.
Complementing the view that today could be the high of the corrective bounce is the IntoTheBlock In/Out of the Money Around Price (IOMAP) metric. It currently shows a sizeable cluster of resistance (out of the money addresses) from $1.21 to $1.24, where 88 addresses own 41.19m ENJ at an average price of $1.23.
The cluster sits right in the middle of the path between the June 8 low and the 200-day SMA, presenting a serious confrontation for bullish ENJ investors.
Moreover, the chart shows marginal support (in the money addresses) below the current price until $0.92, making it an easier journey for the bearish ENJ investors moving forward.
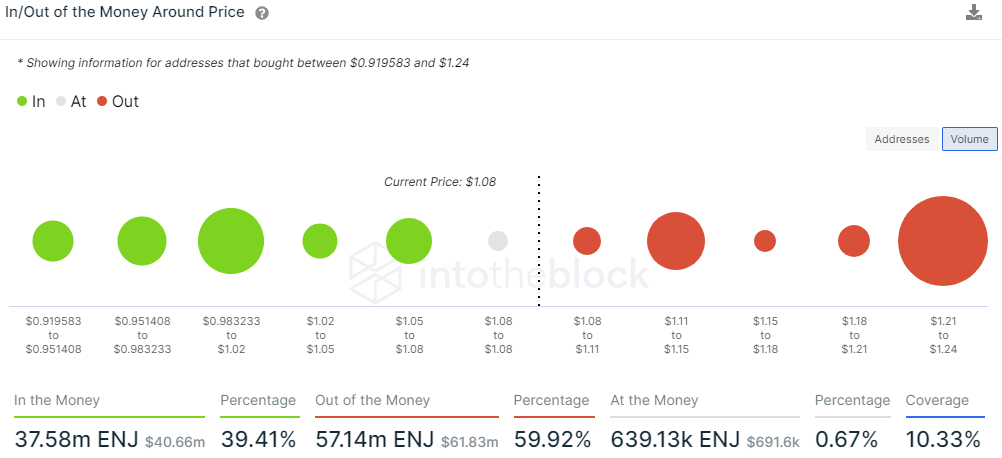
ENJ IOMAP - IntoTheBlock
Another bearish observation is the daily active addresses and new addresses on the platform. They could be bottoming, but they remain well below a level that would constitute a meaningful rebound in user engagement and growth for ENJ.
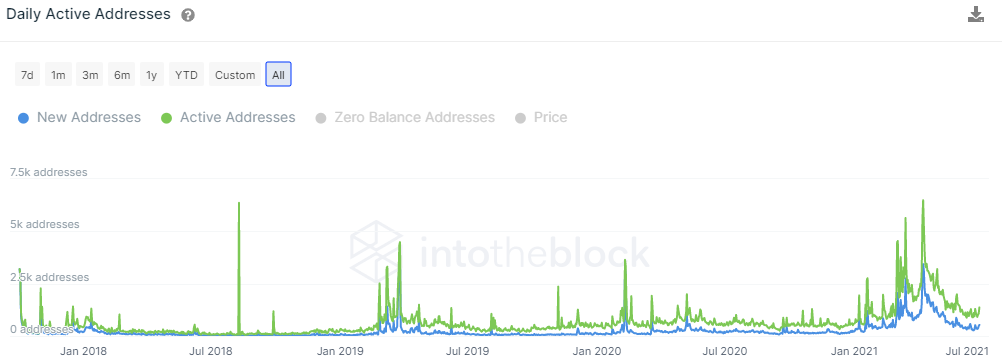
ENJ Daily Active Addresses - IntoTheBlock
At this point, it appears that Enjin Coin price lacks the conviction to prevail at $1.14 and the momentum to overpower the cluster of resistance highlighted in the IOMAP. If successful on both counts, ENJ may have the staying power to reach the 200-day SMA, representing a 15% gain from the critical resistance level of $1.14. The upcoming Death Cross should halt any further upside progress.
Author

Sheldon McIntyre, CMT
Independent Analyst
Sheldon has 24 years of investment experience holding various positions in companies based in the United States and Chile. His core competencies include BRIC and G-10 equity markets, swing and position trading and technical analysis.



