Enjin Coin Price Prediction: ENJ breakdown seems unstoppable, could plunge to $1.4
- Enjin Coin has continued to lose one crucial support after another as declines intensify.
-
The MACD indicator reinforces the breakdown following the slide into the negative region.
-
The IOMAP model reveals immense support areas likely to prevent the potential breakdown.

Enjin Coin retreat has held steady following the breakdown from the all-time high of $3.12. Several tentative support levels failed to hold, leaving ENJ firmly in the hands of the bears. In the meantime, the breakdown is in progress, with Enjin Coin downswing targeting losses toward the major support at $1.4.
Enjin Coin least resistance path is downwards
Enjin Coin's upward movement has been capped under the descending trend line. The support levels that have already been lost include the 50 Simple Moving Average (SMA) on the 4-hour chart, $2.5, and most recently, the 100 SMA.
At the moment, Enjin Coin is trading at $2 amid calls for the bearish leg to stretch further down. The Moving Average Convergence Divergence (MACD) indicator cements the bears' influence over the price. Currently, the MACD line (blue) is holding under the signal line, reinforcing the bearish outlook.
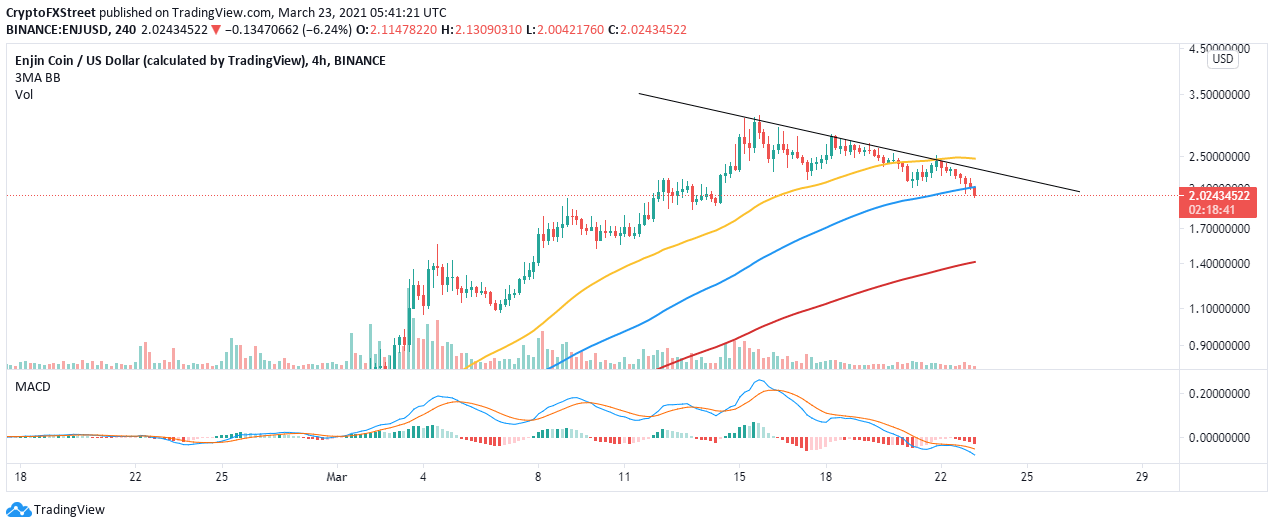
ENJ/USD 4-hour chart
The 4-hour Parabolic SAR indicator has also flipped bearish at the time of writing. This indicator is currently above the price, implying that it was time to short Enjin Coin. As long as the parabolas (dots) stay above the price, we will likely experience a breakdown heading to $1.4.
The bearish outlook has been confirmed by the Relative Strength Index (RSI) on the 4-hour chart, as it dives into the oversold area.
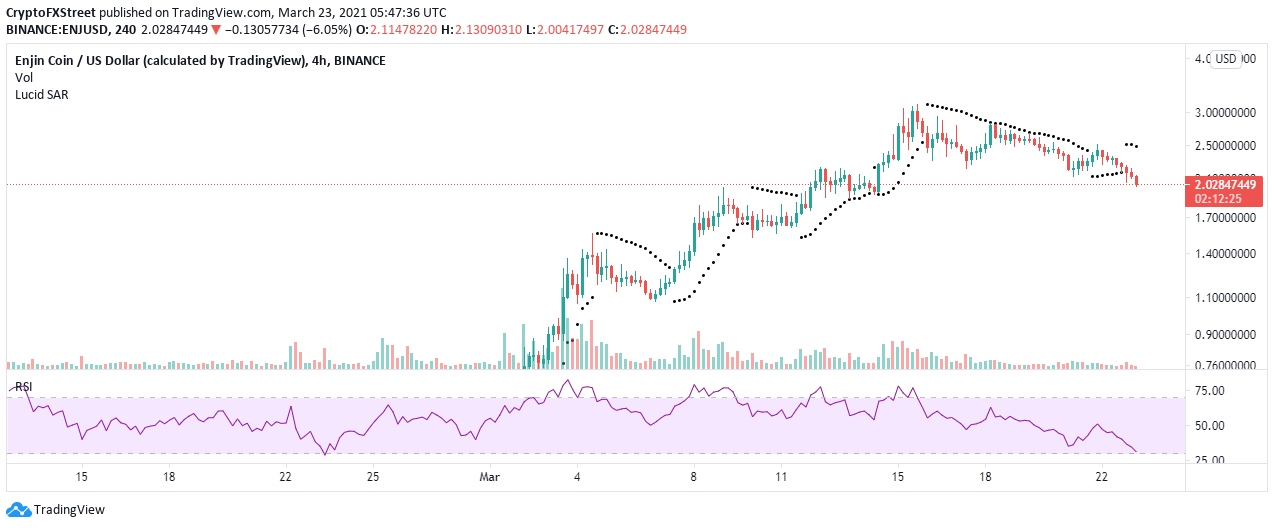
ENJ/USD 4-hour chart
Looking at the other side of the fence
Enjin Coin is sitting on areas with immense support, as shown by IntoTheBlock's IOMAP on-chain metric. The model reveals the most robust support between $1.85 and $1.92. Here, 80 addresses bought roughly 16.8 million ENJ. Trading under this zone would be a farfetched idea for ENJ, thus invalidating the downswing.
-637520779931494284.png)
Enjin Coin IOMAP model
On the upside, the path is relatively smooth apart from the buyer congestion between $2.28 and $2.34. Here, nearly 1,900 addresses had previously purchased 13.5 million ENJ. If buyers build enough pressure to overcome this hurdle, Enjin Coin may resume the uptrend to a new all-time high.
Author

John Isige
FXStreet
John Isige is a seasoned cryptocurrency journalist and markets analyst committed to delivering high-quality, actionable insights tailored to traders, investors, and crypto enthusiasts. He enjoys deep dives into emerging Web3 tren



