Enjin Coin Price Analysis: ENJ 330% rally nears the end as investors prepare to sell
- Enjin Coin struggles with the uptrend after hitting a wall at $2.
- The uptick in the altcoin’s exchange inflow and the NPL hint at increasing overhead pressure.
- Holding above the ascending trendline support could secure the recovery beyond $2.

Enjin Coin is flying the bullish flag high above the cryptocurrency horizon. From March 1, the altcoin has appreciably increased in value, hitting a new all-time high of $2. A correction ensued, but ENJ embraced support at an ascending trendline. Although a recovery appears to be taking shape at the time of writing, on-chain metrics suggest an incoming build-up in selling pressure.
Enjin uptrend in jeopardy based on on-chain metrics
Amid the rally continued on Monday, Enjin saw an uptick in exchange deposits. The increase in the number of tokens entering known exchange wallets is cause for worry because it implies that investors are ready to take advantage of the pump to cash out for profit. For instance, the exchange inflow almost reached 15 million ENJ in the first week of March and likely contributed to the overhead pressure.
%20[12.35.22,%2010%20Mar,%202021]-637509675167208865.png)
Enjin Coin exchange inflow
On-chain data by Santiment also reveals the profit taking is bound to take precedence based on the ENJ’s Network Realized Profit or Loss (NPL). This metrics measures network-level ROI related to all the daily transactions. An increase in the value of NPL suggests investors are moving coins intending to sell. Several spikes in the NPL have been observed since March 3, prompting the surge in selling pressure.
%20[12.44.07,%2010%20Mar,%202021]-637509675239007426.png)
Enjin Coin NPL chart
Enjin Coin technical turning bearish
Enjin Coin is trading at $1.69 following a correction from highs above $2. Short-term support has been embraced at the ascending trendline, and bulls seem to be pushing for gains above $2.
However, the Moving Average Convergence Divergence (MACD) has recently hit a snag and moves toward the midline. Besides, the MACD line (blue) crossed beneath the signal line, adding credibility to the building selling pressure. As long as the MACD maintains the negative gradient, ENJ’s recovery will be an uphill task.
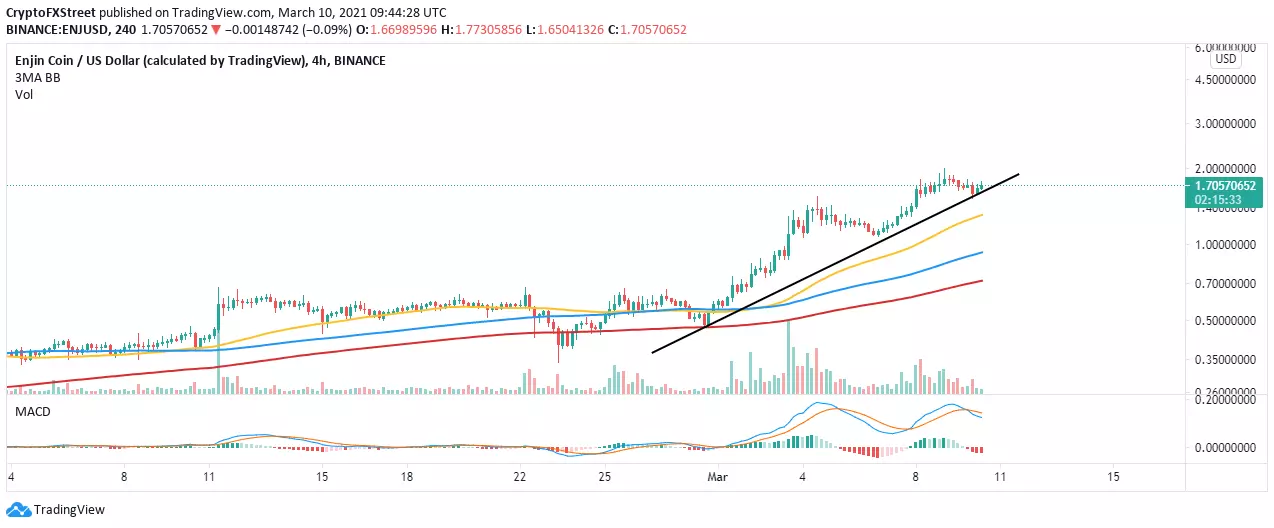
ENJ/USD 4-hour chart
It is worth mentioning that the uptrend to $2 will hold water if Enjin Coin sticks above the ascending trendline. If the immediate support stays intact, bulls have the opportunity to focus on gains above $2 and perhaps jumpstart another rally.
Author

John Isige
FXStreet
John Isige is a seasoned cryptocurrency journalist and markets analyst committed to delivering high-quality, actionable insights tailored to traders, investors, and crypto enthusiasts. He enjoys deep dives into emerging Web3 tren




