Elrond price pattern forecasts a 50% gain from the current entry price
- Elrond price now on the fourth attempt to breakout from an ascending triangle pattern.
- A spike in positive social sentiment accompanying the improving price action.
- Today’s volume already above the daily average, lending credibility.

Elrond price has been trending sideways with a mild uptrend since the sharp collapse in late February. The resulting ascending triangle pattern has been trying to resolve upwards since April 2. Today, EGLD is attempting to breakout for the fourth time, with a gain of 12.7% at the time of writing. It would be the second-largest daily return since the February high.
Elrond price strength being noticed on Twitter
Getting attention in the cryptocurrency complex is not easy for EGLD considering it ranks 41st in market capitalization. Yesterday, the altcoin registered the highest positive sentiment on Twitter since the end of December. The spike in sentiment coincides with the developing advance from the ascending triangle.
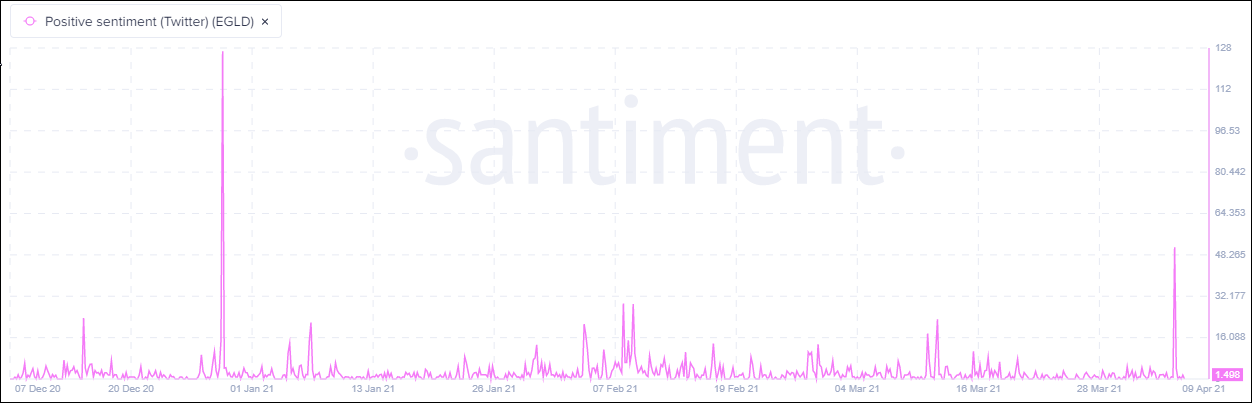
Source: Santiment
On February 8, Elrond price hit $236.55, slightly exceeding the 1.618 Fibonacci extension of the 2019-2020 bear market at $234.44. EGLD began a decline of 60% the following day before bottoming near the 50-day simple moving average (SMA).
Today’s rally is stalling just above the 0.786 retracement level of the February correction at $191.96. A successful close above that level will put EGLD on pace to test the all-time high and the Fibonacci extension mentioned in the above paragraph.
The measured move target based on the ascending triangle pattern is $253.21, yielding a 50% gain. Aggressive targets include the 1.382 extension level of the February correction at $343.41 and then the 1.618 extension level at $432.35.
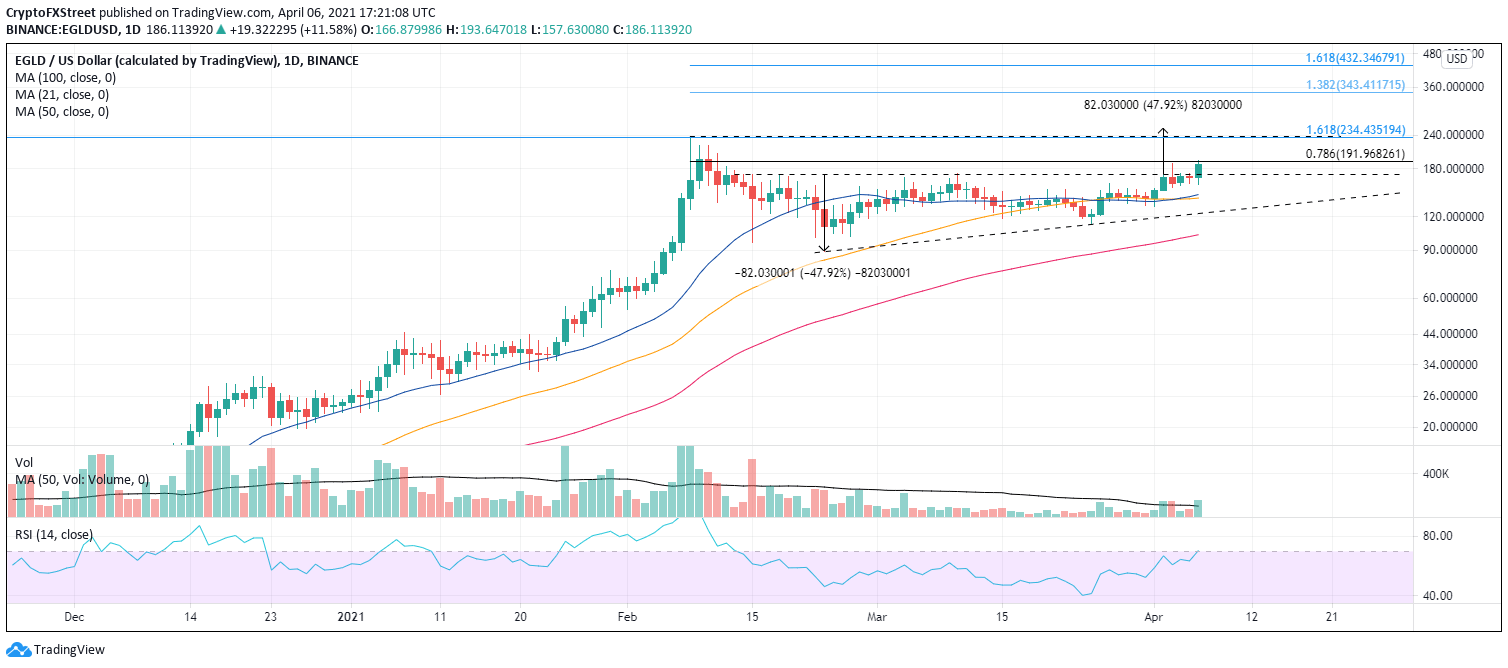
EGLD/USD daily chart
The union of the 21-day SMA and 50-day SMA, around $142.00, is the first level of support, followed by the rising trendline at $123.00. A daily close below the trendline could expose EGLD to a decline to the 100-day SMA at $102.83.
Author

Sheldon McIntyre, CMT
Independent Analyst
Sheldon has 24 years of investment experience holding various positions in companies based in the United States and Chile. His core competencies include BRIC and G-10 equity markets, swing and position trading and technical analysis.



