|

Elliott Wave View: Ethereum rally likely corrective [Video]

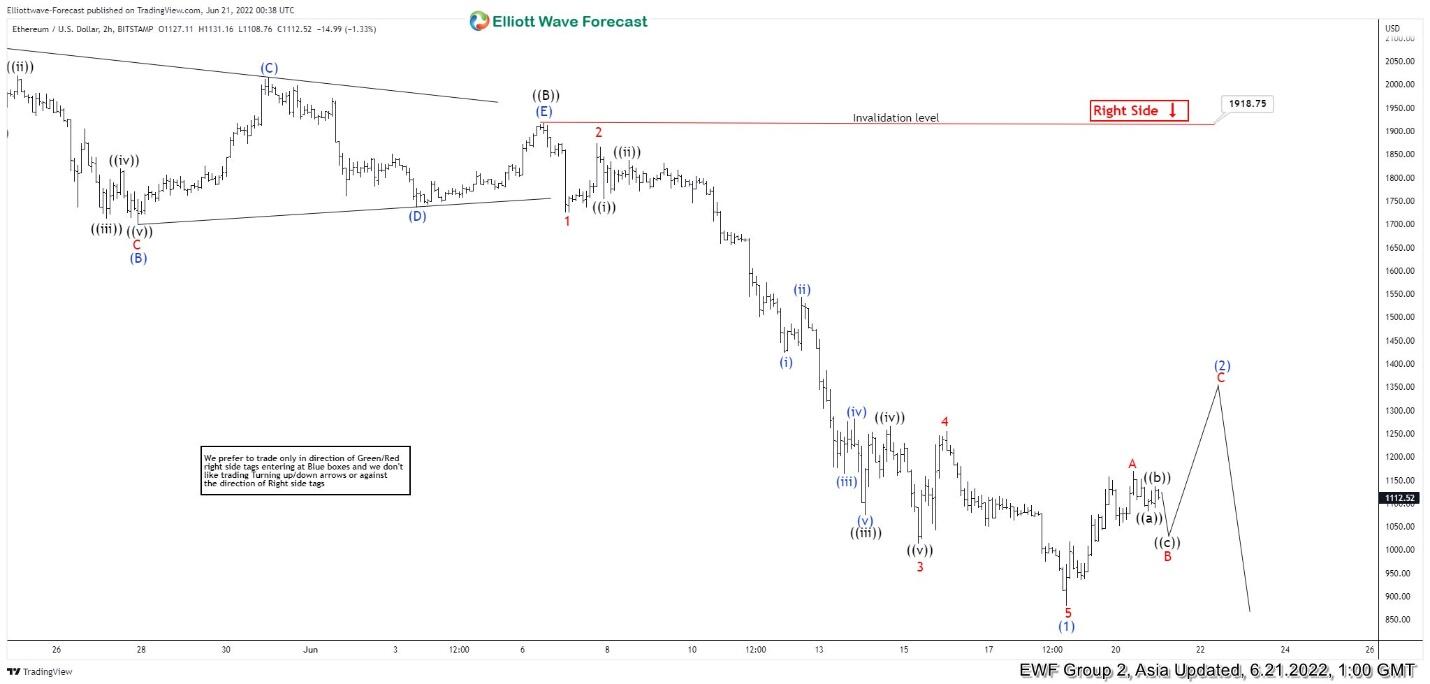
Short term Elliott Wave view in Ethereum (ETH/USD) suggests that the decline from March 28, 2022 high is unfolding as a zigzag Elliott Wave structure. Down from March 28, 2022 high, wave ((A)) ended at 1700 and wave ((B)) ended at 1918.17. Wave ((C)) lower is currently in progress as the chart below shows. Internal subdivision of wave ((C)) is unfolding as a 5 waves impulse structure. Down from wave ((B)), wave 1 ended at 1725.21 and rally in wave 2 ended at 1874.03. The crypto currency then extends lower again in wave 3 towards 1013, and rally in wave 4 ended at 1255.55. Final leg lower wave 5 ended at 880 which completed wave (1).

Wave (2) rally is now in progress as a zigzag structure to correct cycle from June 6 high before the decline resumes. Up from wave (1), wave A ended at 1169.50. Expect Ethereum to pullback in wave B then rally again in wave C before ending wave (2) and turns lower. Near term, as far as June 6 pivot high at 1918.75 stays intact, expect rally to fail in 3, 7, or 11 swing for further downside. Potential target lower is 100% – 123.6% Fibonacci extension from November 2021 high which comes at 233 – 872 area.

Ethereum 2 Hours Elliott Wave Chart

ETH/USD Elliott Wave Video

Author

Elliott Wave Forecast Team

Elliott Wave Forecast Team

ElliottWave-Forecast.com

More from Elliott Wave Forecast Team
Share:

Editor's Picks

XRP steadies in narrow range as fund inflows, futures interest rise

Ripple is trading in a narrow range between $1.45 (immediate support) and $1.50 (resistance) at the time of writing on Monday. The remittance token extended its recovery last week, peaking at $1.67 on Sunday from the weekly open at $1.43. 

Crypto Today: Bitcoin, Ethereum, XRP trade within range amid low retail interest 

Bitcoin, Ethereum and Ripple continue to exhibit subdued volatility, consolidating within narrow ranges at the time of writing on Monday. Persistent low retail participation and weak technical structures limit the chances of any extended upside price movements.

Bitcoin consolidates as on-chain data show mixed signals

Bitcoin price has consolidated between $65,700 and $72,000 over the past nine days, with no clear directional bias. US-listed spot ETFs recorded a $359.91 million weekly outflow, marking the fourth consecutive week of withdrawals.

Monero Price Forecast: XMR risks a drop below $300 under mounting bearish pressure

Monero (XMR) starts the week under pressure, recording a 4% decline at press time on Monday after a 7% drop the previous day, putting the $300 support zone in focus.

Bitcoin Price Annual Forecast: BTC holds long-term bullish structure heading into 2026

Bitcoin (BTC) is wrapping up 2025 as one of its most eventful years, defined by unprecedented institutional participation, major regulatory developments, and extreme price volatility.

Bitcoin: BTC bears aren’t done yet

Bitcoin (BTC) price slips below $67,000 at the time of writing on Friday, remaining under pressure and extending losses of nearly 5% so far this week.