Elliott Wave View: Bitcoin (BTC/USD) recovery in progress [Video]
![Elliott Wave View: Bitcoin (BTC/USD) recovery in progress [Video]](https://editorial.fxstreet.com/images/Markets/Currencies/Digital Currencies/Bitcoin/bitcoins-33646574.jpg)
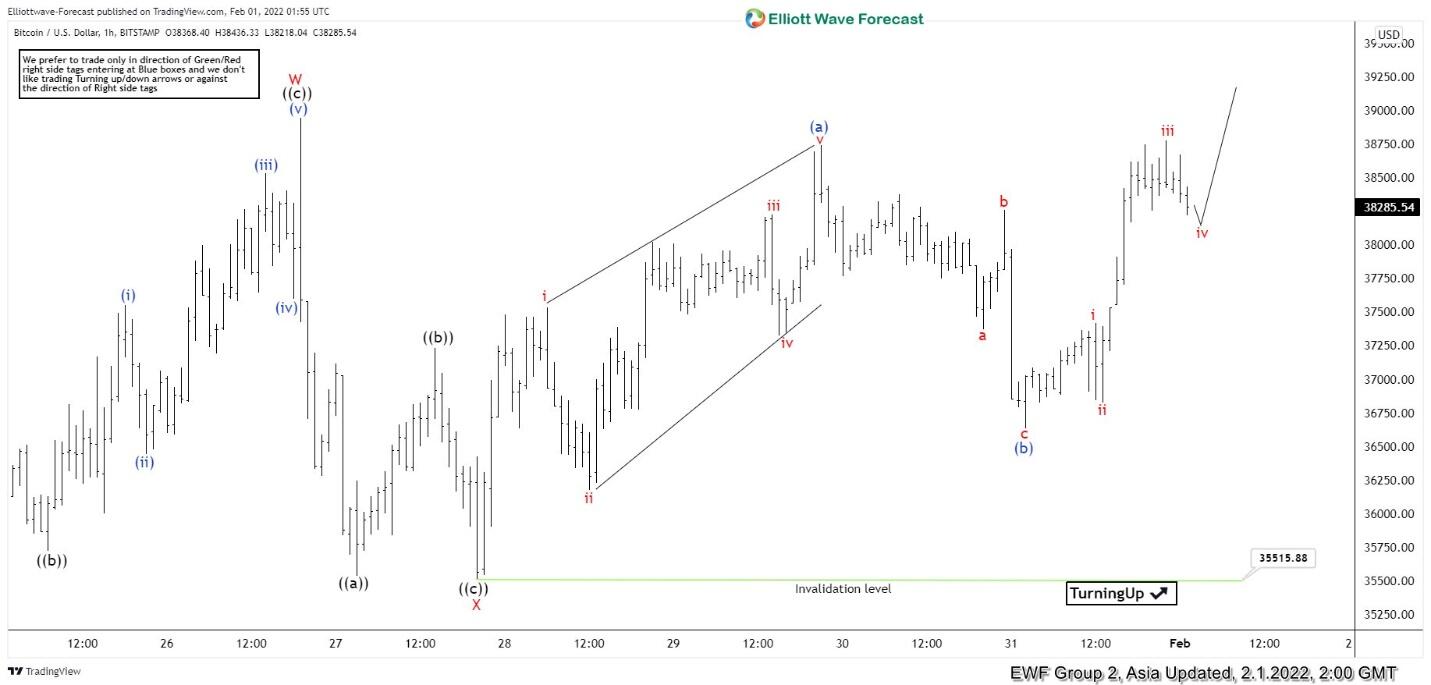
Short Term Elliott Wave view in Bitcoin (BTCUSD) suggests the rally from January 24, 2022 low is in progress as a double three Elliott Wave structure. Up from January 24 low, wave W ended at 38946 and pullback in wave X ended at 35511.32. Wave X has a zigzag structure subdivision as the 1 hour chart below shows. Down from wave W, wave ((a)) ended at 35535, wave ((b)) ended at 37230 and wave ((c)) ended at 35515.88. Wave Y is currently in progress with internal subdivision as a double three in lesser degree.
Up from wave X, wave i ended at 37534.15 and wave ii ended at 36173.98. Wave iii ended at 38225.27, wave iv ended at 37327.79, and wave v ended at 38741.67. This completed wave (a) in higher degree. Wave (b) pullback ended at 36631.66 with internal subdivision as a zigzag. Down from wave (a), wave a ended at 37372.59, wave b ended at 38262.55, and wave c ended at 36631.66. Wave (c) higher is in progress with potential target of 100% – 161.8% Fibonacci extension of wave (a). This area comes at 39862.01 – 40624.37 where wave (c) of ((w)) may end. Near term, as far as pullback stays above 35515.88, expect Bitcoin to extend the recovery higher.
Bitcoin 1 Hour Elliott Wave Chart
Bitcoin (BTCUSD) 1 Hour Elliott Wave Video
Author

Elliott Wave Forecast Team
ElliottWave-Forecast.com


