Litecoin Price Forecast: LTC slips below $70 as whales offload tokens
- Litecoin price trades in the red on Tuesday after reaching its lowest level in three months at $65.58 the previous day.
- On-chain data paints a bearish outlook, as whales are offloading LTC alongside a decline in social dominance.
- The technical outlook suggests further correction, as momentum indicators signal a bearish bias.

Litecoin (LTC) price continues to trade below $70 on Tuesday, after reaching its lowest level in three months at $65.58 the previous day. The bearish outlook strengthens as whales offload LTC, increasing selling pressure. On the technical side, momentum indicators signal weakness, suggesting further correction ahead.
Whales reduce exposure to LTC
Santiment’s Supply Distribution data supports a bearish outlook for Litecoin, as the number of large-wallet holders (whales) is reducing exposure.
The metric indicates that whales holding between 1 million and 10 million (yellow line) LTC tokens have shed 1.08 million tokens since January 12. In the same period, whales holding tokens between 100,000 and 1 million (red line) have accumulated 0.78 million LTC tokens. This indicates a shift in positioning among large holders, with top-tier whales reducing exposure. In contrast, mid-sized whales absorb some of the supply, often reflecting distribution at higher levels and adding to near-term downside risks for Litecoin.
 [10-1768888260001-1768888260002.17.15, 20 Jan, 2026].png)
In addition, Santiment’s Social Dominance metric for Litecoin also supports a bearish outlook. The index measures the share of LTC-related discussions across the cryptocurrency media. It has been sliding down since Saturday and reached 0.084%on Thursday, nearing the lowest level since early January. This fall indicates fading market interest and weakening sentiment among LTC investors.
 [11-1768888321144-1768888321146.01.48, 20 Jan, 2026].png)
Another bearish sign for LTC is fading institutional demand for its Spot Exchange Traded Funds (ETFs). SoSoValue data shows that Canary, which launched LTC spot ETFs, has accumulated only $9.10 million net assets as of Tuesday, compared to Solana (SOL) and Ripple (XRP), which have total net assets of $1.21 billion and $1.52 billion, respectively. This highlights Litecoin’s relatively weak institutional traction compared to other major altcoins, suggesting limited ETF-driven demand to support prices in the near term.



Litecoin Price Forecast: LTC momentum indicators suggest a deeper correction
Litecoin price was rejected from the 50-day Exponential Moving Average (EMA) at $80.05 on January 14 and declined nearly 10% through Monday, reaching a low of $65.58, levels not seen since three months. At the time of writing on Tuesday, LTC is trading down at $70.33.
If LTC continues its downward trend, it could extend the decline to the weekly support at $56.
The Relative Strength Index (RSI) on the daily chart is 33, below its neutral level of 50, pointing downward toward oversold territory, which indicates strong bearish momentum. Moreover, the Moving Average Convergence Divergence (MACD) showed a bearish crossover on January 12, with rising red histogram bars below the neutral level, further supporting the negative outlook.
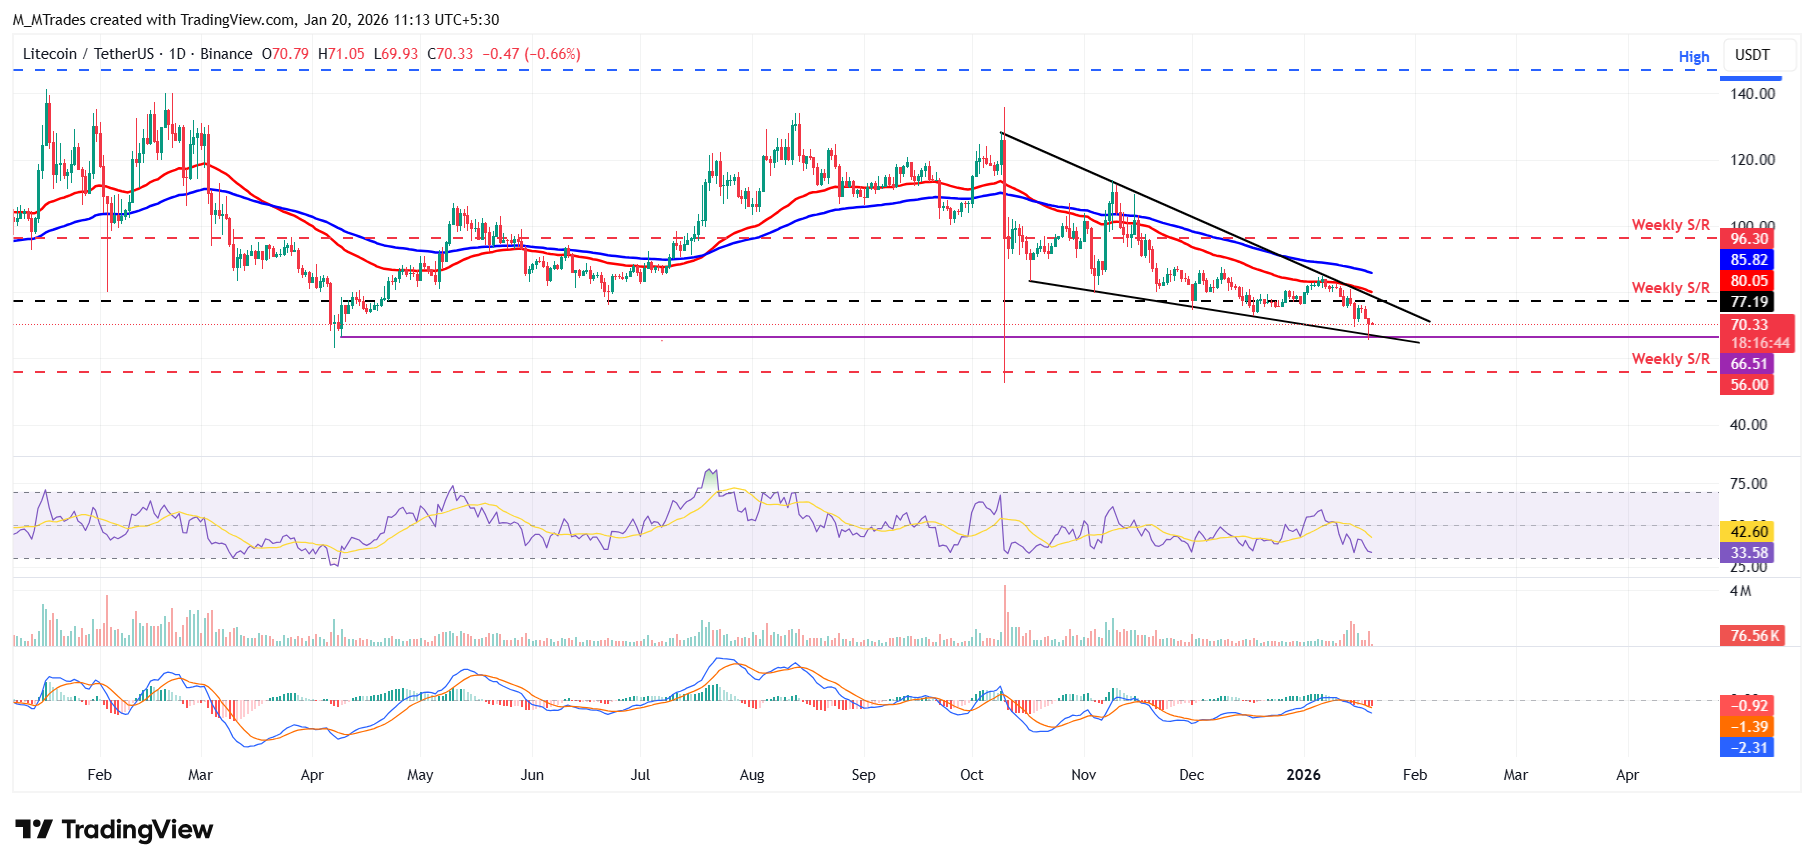
However, if LTC recovers, it could extend the recovery toward the weekly resistance at $77.19.
Author

Manish Chhetri
FXStreet
Manish Chhetri is a crypto specialist with over four years of experience in the cryptocurrency industry.