Pepe Price Forecast: Bullish momentum builds as open interest, funding rate support rally hopes
- PEPE price jumps over 5% on Wednesday after rebounding from a key support level the previous day.
- On-chain data shows rising open interest and a flip to positive funding rates, signaling strong bullish sentiment.
- The technical outlook on daily and weekly charts indicates a potential double-digit gain ahead.

Pepe (PEPE) price trades higher by over 5% on Wednesday, trading around $0.000013, fueled by a rebound from a key support level. The rise in Open Interest (OI) and a shift to positive funding rates suggest growing trader confidence and potential for further upside. The technical analysis of the daily and weekly time frames indicates a potential double-digit gain for the frog-themed meme coin.
Pepe’s bullish sentiment is on the rise
Coinglass’ data shows that the futures’ OI in PEPE at exchanges rose to $599.98 million on Wednesday from $530 million on Tuesday. An increasing OI represents new or additional money entering the market and new buying, which could fuel the current PEPE price rally.
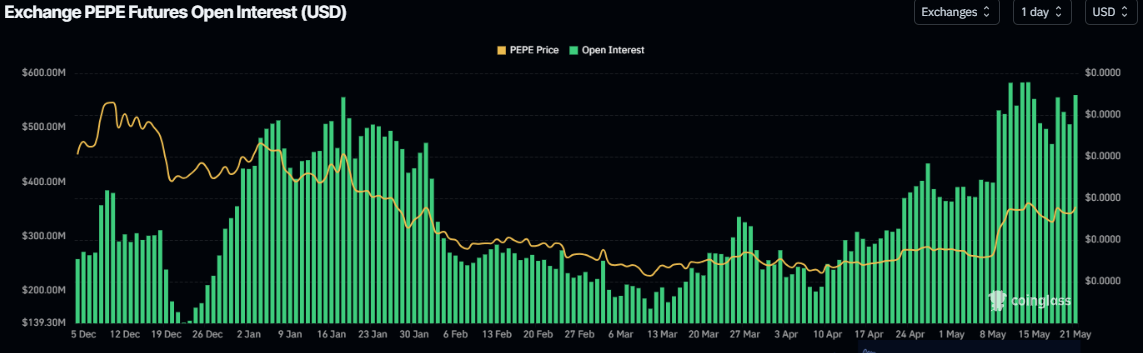
PEPE’s open interest chart. Source: Coinglass
Coinglass’s OI-Weighted Funding Rate data shows that the number of traders betting that the price of frog-themed meme coin will slide further is lower than that anticipating a price increase. Generally, a positive rate (longs pay shorts) indicates bullish sentiment, while negative numbers (shorts pay longs) indicate bearishness.
The metric has flipped a positive rate and reads 0.0013% on Wednesday, indicating that longs are paying shorts. Historically, as shown in the chart below, when the funding rates have flipped from negative to positive, Pepe’s price has rallied sharply, as seen on May 8.
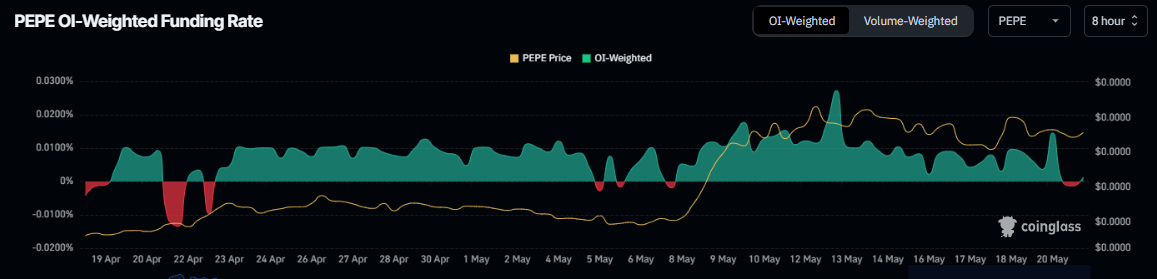
Pepe funding rate chart. Source: Coinglass
Pepe Price Forecast: Bulls take control of the momentum
Pepe's price on the weekly chart shows that it has retested and found support around the weekly support level of $0.0000125 since last week. As of this week, this level holds strong, and when writing on Wednesday, PEPE trades around $0.000013.
If the weekly level at $0.0000125 remains strong, PEPE could extend the rally to retest the 50% Fibonacci retracement level (drawn from the December high of $0.0000283 to the March low of $0.0000052) at $0.0000168, nearly 30% higher than current levels.
The Relative Strength Index (RSI) on the weekly chart reads 57, above its neutral level of 50, indicating bullish momentum. Additionally, the Moving Average Convergence Divergence (MACD) on the weekly chart showed a bullish crossover in early May. It also shows rising green histogram bars above its neutral zero line, suggesting bullish momentum gaining traction and continuing an upward trend.
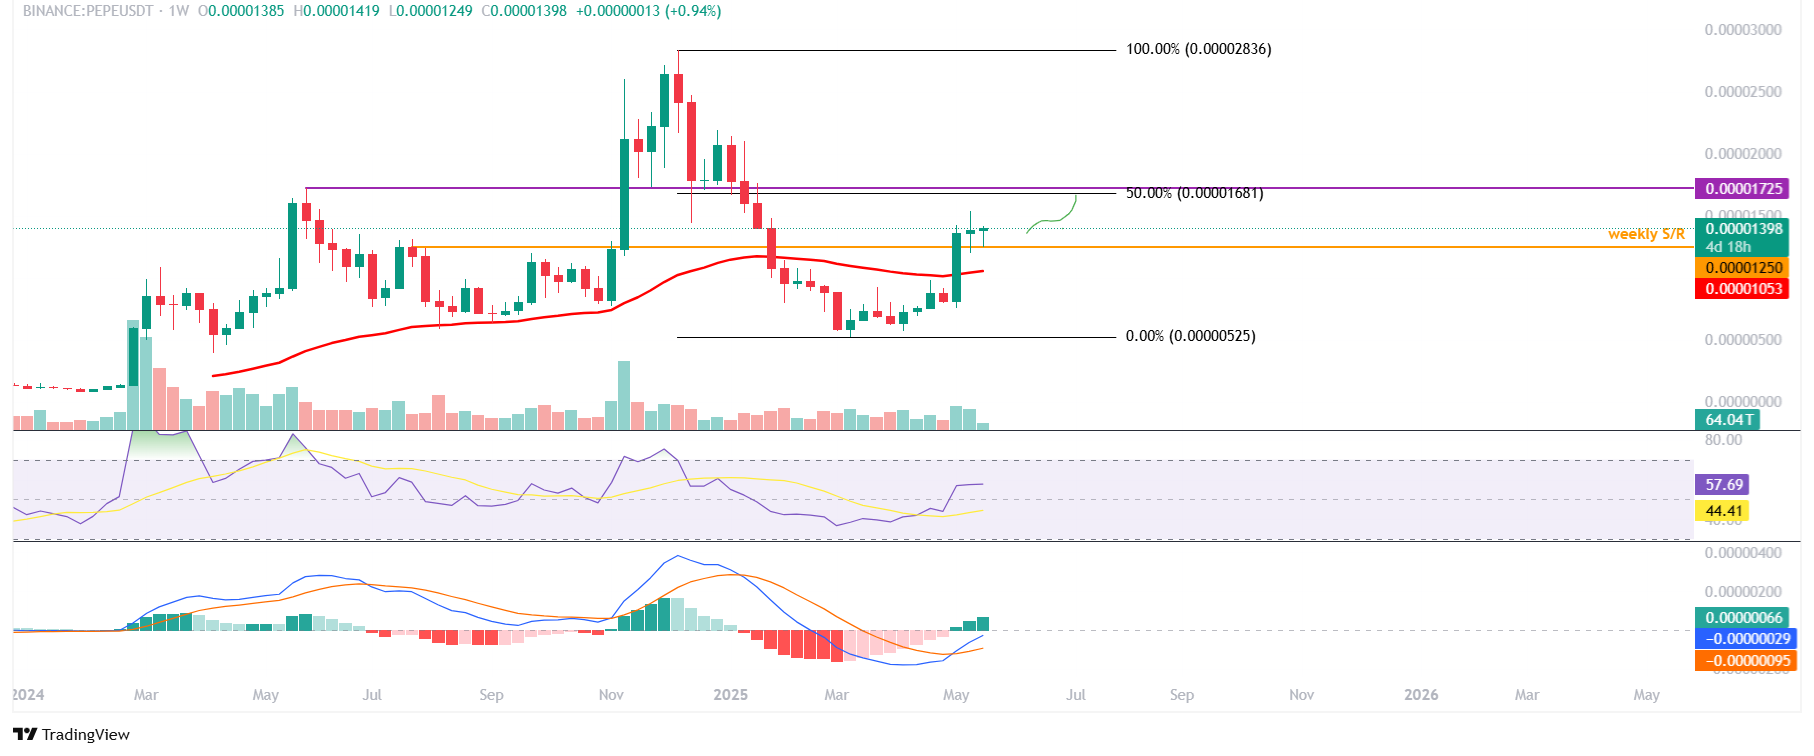
PEPE/USDT weekly chart
The daily chart also suggests a bullish projection. Pepe price has retested and found support around its daily support of $0.0000130 since the start of this week until Tuesday. At the time of writing on Wednesday, it is higher by over 5% at around $0.0000139.
If Pepe continues its upward trend, it could extend the rally to retest its next daily resistance at $0.0000165.
The RSI on the daily chart reads 66, below overbought conditions, with room for upward momentum. However, the MACD indicator lines on the daily chart are coiling together, indicating indecisiveness among traders. If the MACD flips a bullish crossover, it would give a buy signal and further support the bullish thesis.
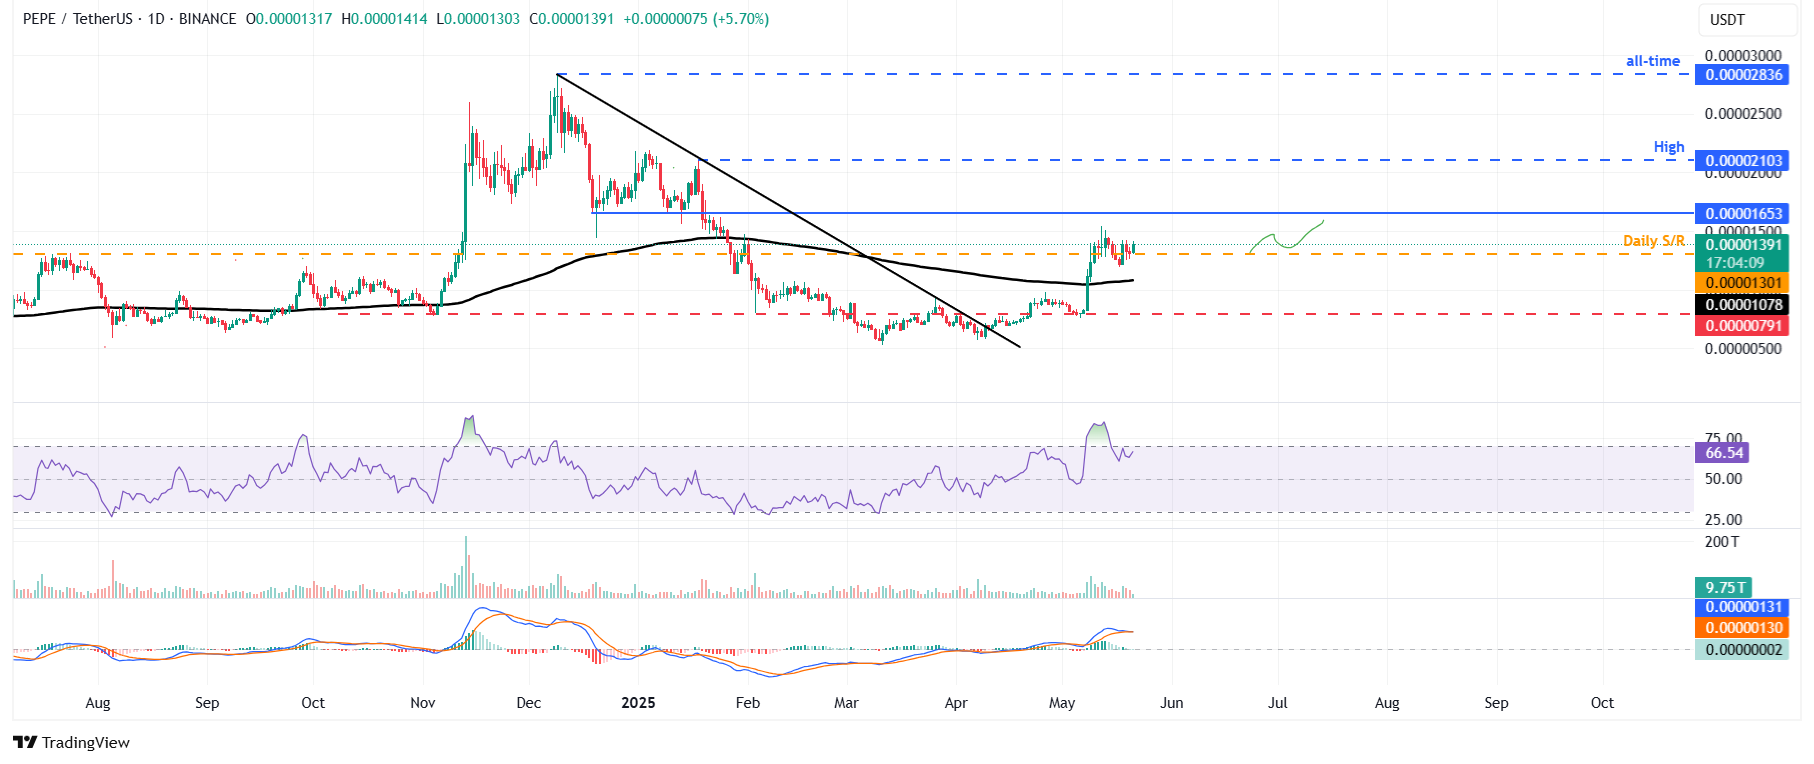
PEPE/USDT daily chart
However, if PEPE faces a correction, it could extend the decline to retest the 200-day Exponential Moving Average (EMA) at $0.0000107.
Author

Manish Chhetri
FXStreet
Manish Chhetri is a crypto specialist with over four years of experience in the cryptocurrency industry.




