Dogecoin price wavers, but $0.223 dictates DOGE outlook
- Dogecoin price closes below the lower trend line of a symmetrical triangle pattern, hinting at lower prices.
- May’s declining trend line at $0.223 provides support as the cryptocurrency complex suffers another rough day.
- Bearish Death Cross pattern on the 12-hour chart may intensify the downward pressure on DOGE.

Dogecoin price rebound from the 200-day simple moving average (SMA) on June 22 marked a bullish departure from the weakness that branded price action through much of May and June. The price action proceeding the bounce from the low formed a symmetrical triangle pattern that triggered today with a 12-hour close below the triangle’s lower trendline. It is a bearish development, provoking some concern about DOGE intentions moving forward, but May’s declining trend line is the final judge.
Dogecoin price may be in potential bear trap
On June 22, Dogecoin price initiated a compelling rally off the 200-day SMA at $0.150 with above-average volume and followed by a 23% gain on June 23, the largest up day since the 25% gain on May 13. The notable jump in DOGE volume combined with the conviction of the rebound from the strategically important moving average pointed to prominent investor interest as big money tends to gravitate towards actionable support levels that offer great value.
The significance of the bullish bid quickly lifted Dogecoin price to the intersection of May’s declining trend line at $0.288 with the 23.60% retracement of the May-June correction at $0.296. Since the June 25, high DOGE coiled in a symmetrical triangle pattern and released the rally's price compression.
As a continuation pattern, it suggested better price outcomes for the meme token, but today’s close below the triangle’s lower trend line dictates a rethink of the original bullish outlook. Moreover, the bearish Death Cross pattern on the 12-hour chart warns DOGE investors projecting an easy path to higher prices.
The DOGE symmetrical triangle measured move is 21%. Based on the position of the triangle’s lower trend line today, the Dogecoin downside price target is $0.193, taking the meme token below May’s declining trend line currently at $0.223.
However, today’s drop could be a bear trap as the pressure of a weak cryptocurrency market, and rising enthusiasm surrounding Baby Doge Coin have put Dogecoin price on the defensive. Thus, as long as May’s declining trend line at $0.223 holds, DOGE has the basis on which to initiate a convincing rebound.
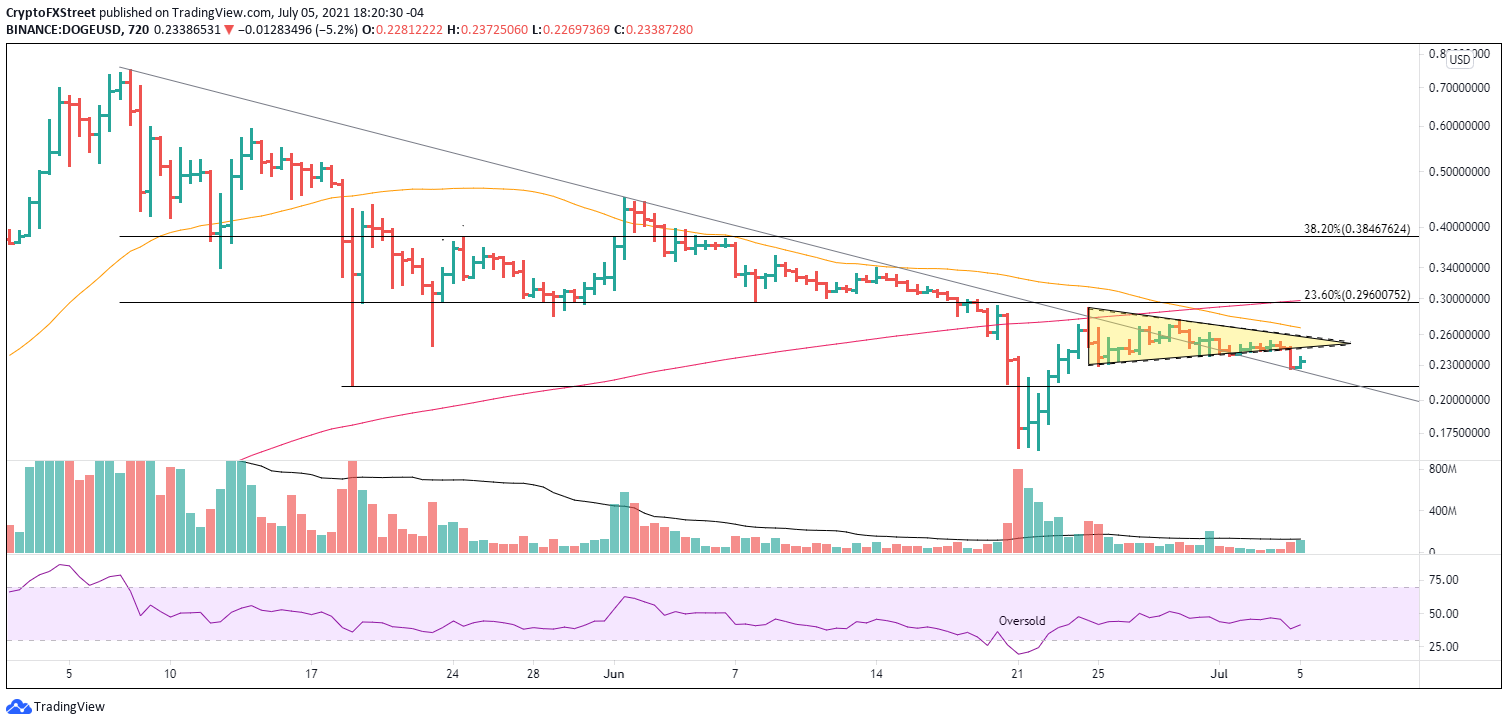
DOGE/USD 12-hour chart
If Dogecoin price fails to hold May’s declining trend line, DOGE could be overcome with sustained selling pressure, pressing the digital asset to test the 200-day SMA at $0.166 and possibly sweep the June 22 low $0.152, presenting a 20% decline from the current price.
The convincing response to the 200-day SMA by Dogecoin price was lead by prominent investors. Nevertheless, the breakdown from the symmetrical triangle today has the bullish outlook under pressure as $0.223 provides solid intra-day support, making it the final word on the future outlook.
Here, FXStreet's analysts evaluate where DOGE could be heading next with a brief technical and on-chain analysis on Dogecoin price.
Author

Sheldon McIntyre, CMT
Independent Analyst
Sheldon has 24 years of investment experience holding various positions in companies based in the United States and Chile. His core competencies include BRIC and G-10 equity markets, swing and position trading and technical analysis.


