- Dogecoin price remains in the red for the third day in a row.
- A wall of resistances on the 4H chart keeps DOGE exposed to downside risks.
- DOGE bears target the next support at $0.26 amid bearish RSI.
Dogecoin (DOGE/USD) sellers appear to take a breather, although remain on the defensive so far this Sunday, especially in light of Wednesday’s massive crash.
During the midweek market meltdown, DOGE price lost as much as 55% at one point before closing the day 30% lower around $0.33.
Elon Musk, Tesla Inc’s founder, tweets in the aftermath of the crash failed to offer any respite to the meme-based coin, as China’s regulatory clampdown on the crypto markets outweighed the optimistic remarks from the world’s third-richest person.
"Yeah, I haven't & won't sell any Doge," Musk said on Twitter in response to a tweet on Thursday claiming he would never sell any of his doge holdings and that he was the "ultimate hodler".
The sixth-largest digital currency, with a market capitalization of $43.67 billion has immensely benefited by the celebrity endorsement so far this year, as it remains Musk’s most favorite crypto coin.
DOGE/USD: Risks remain skewed to the downside
Dogecoin’s four-hour chart shows that the price is in a consolidative mode below the critical short-term 21-simple moving average (SMA) at $0.3623.
Despite the market turbulence experience this week, the DOGE price continued to trend within the two-week-old falling wedge formation.
The Relative Strength Index (RSI) points south towards the oversold territory while currently trading at 37.20.
Therefore, the DOGE bears could test the falling wedge support at $0.2602 if a fresh selling wave grips the broad crypto space.
The swing low of $0.1950 could be retested should the price yields a falling wedge breakdown.
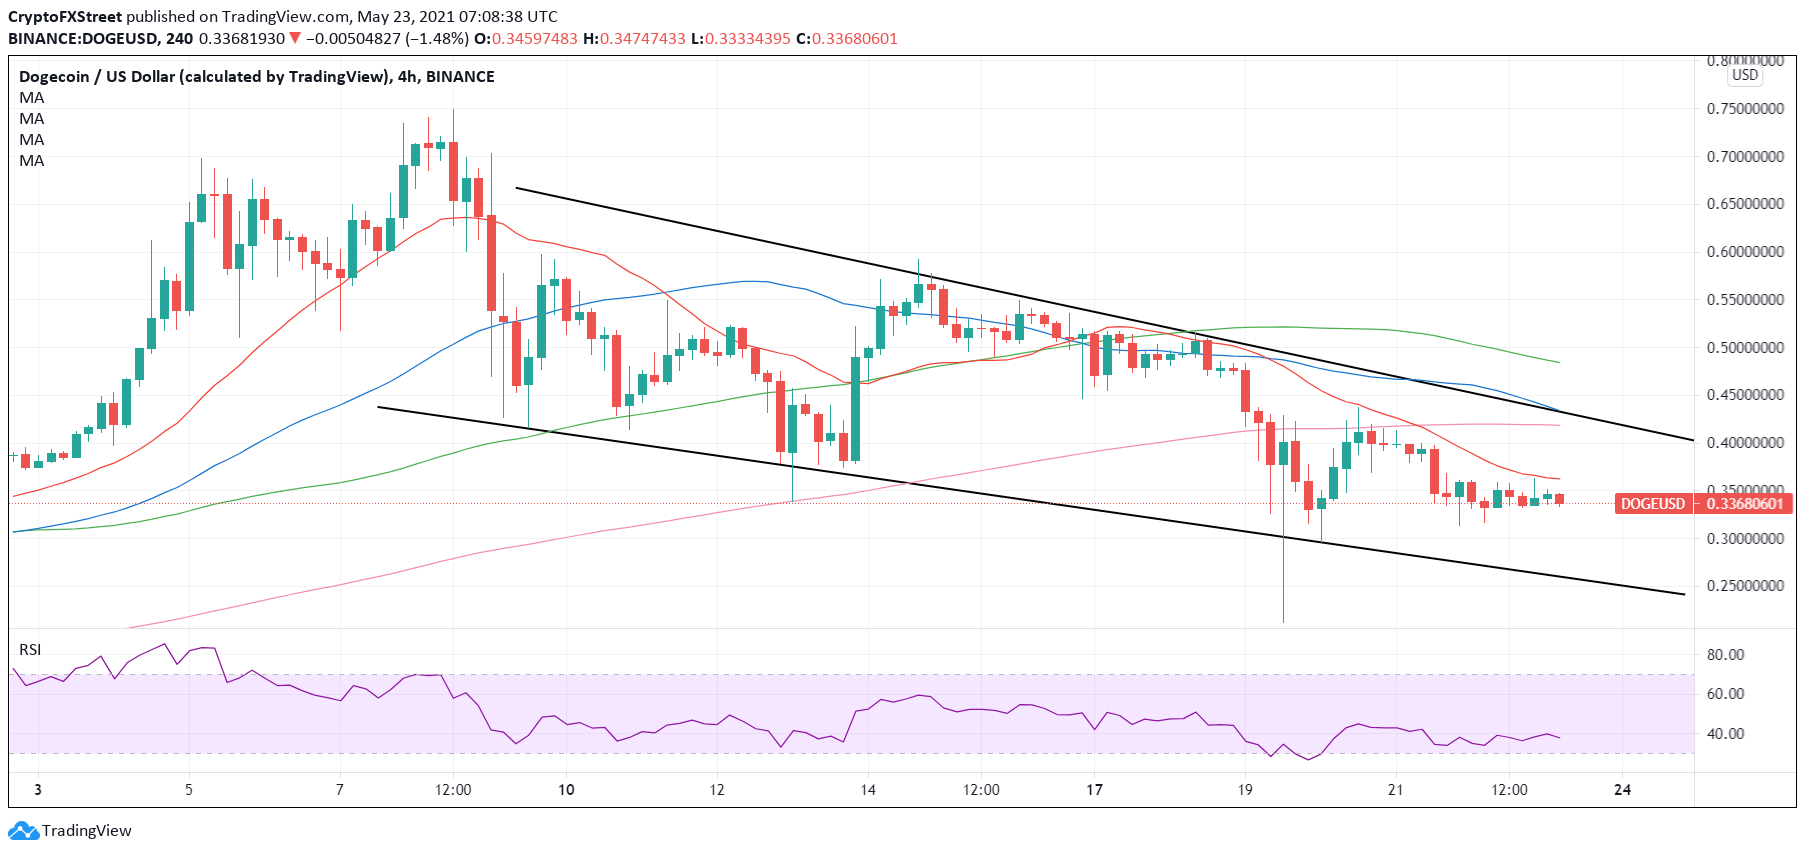
DOGE/USD: Four-hour chart
However, a rebound from the wedge support could call for a test of the 21-SMA resistance, above which the 200-SMA at $0.4199 could be challenged.
The next bullish target aligns at $0.4304, where the 50-SMA and wedge resistance coincide.
A four-hourly candlestick closing above the latter would confirm a wedge breakout, with the descending 100-SMA at $0.4841 emerging as the immediate hurdle.
Information on these pages contains forward-looking statements that involve risks and uncertainties. Markets and instruments profiled on this page are for informational purposes only and should not in any way come across as a recommendation to buy or sell in these assets. You should do your own thorough research before making any investment decisions. FXStreet does not in any way guarantee that this information is free from mistakes, errors, or material misstatements. It also does not guarantee that this information is of a timely nature. Investing in Open Markets involves a great deal of risk, including the loss of all or a portion of your investment, as well as emotional distress. All risks, losses and costs associated with investing, including total loss of principal, are your responsibility. The views and opinions expressed in this article are those of the authors and do not necessarily reflect the official policy or position of FXStreet nor its advertisers. The author will not be held responsible for information that is found at the end of links posted on this page.
If not otherwise explicitly mentioned in the body of the article, at the time of writing, the author has no position in any stock mentioned in this article and no business relationship with any company mentioned. The author has not received compensation for writing this article, other than from FXStreet.
FXStreet and the author do not provide personalized recommendations. The author makes no representations as to the accuracy, completeness, or suitability of this information. FXStreet and the author will not be liable for any errors, omissions or any losses, injuries or damages arising from this information and its display or use. Errors and omissions excepted.
The author and FXStreet are not registered investment advisors and nothing in this article is intended to be investment advice.
Recommended Content
Editors’ Picks
Ethereum whales turn bullish with Shanghai upgrade less than a month away

Ethereum (ETH) whales holding between 1,000 and 10,000 ETH have been scooping up the altcoin consistently for a week. With the countdown to the Shanghai upgrade and the ETH token unlock event, there is a spike in Ethereum demand among retail investors.
Ripple price to close the week with a bang as next week will be crucial for another 20% profit

Ripple price is closing this week with very profitable numbers, even if a fade is ongoing. The fade occurred after bulls received a firm rejection at $0.50 and have been trading lower from that level since. If bulls can keep their hands on this momentum and the Relative Strength Index (RSI) is not overbought, at least some 20% profit is being prepared for next week.
Will Cardano price advance as analysts call it one of the favorite altcoins next to EOS and COLT to pop?

Cardano (ADA) price is making the cut and has been shortlisted by several analysts that have put ADA in their top altcoin, primed to explode to the upside soon. ADA is flirting with a second week of gains and could recover its attempt to hit $0.415 as a crucial level for any further uptrend or downtrend.
Is the new partnering-up strategy the right way for Vechain price to avoid a 30% correction?

Vechain (VET) price had a busy week as several new partnerships were announced. Next to integrating with Dappradar to promote cross-chain visibility, the partnership with Boston Consulting Group might be the one that draws the most attention. Vechain price though is not taking this news in a good way and rather is at risk of tanking further.
Bitcoin: Should you trust this BTC sell signal or wait for $34,000?

Bitcoin price shows a clear picture of its rally after it breached a long-term bullish pattern in mid-January. As the rally takes a breather, sell signs have started to emerge, which is putting investors in a confused state.