Dogecoin price locked in downtrend as DOGE bears take the wheel
- Dogecoin price is locked within a bearish continuation pattern as buyers are nowhere to be found.
- Unless DOGE escapes above $0.208, the meme token could continue to trend lower.
- Slicing below $0.176 might spell even more trouble for the bulls.

Dogecoin price is sealed in a consolidation pattern as DOGE fails to galvanize investors’ enthusiasm. Until the canine-themed token is able to overcome a flurry of obstacles with the final hurdle at $0.23, the meme token may continue to be trapped within a downtrend.
Dogecoin price confined in tight range
Dogecoin price is trapped within a descending parallel channel on the 4-hour chart, as DOGE continues to print lower highs and lower lows. The meme token is attempting to recover from the swing low at $0.186 on November 26 but is confronted with the first area of resistance at the middle boundary of the governing technical pattern at $0.208.
Unless Dogecoin price is able to slice above the aforementioned hurdle, DOGE may continue to consolidate. The dog-themed token may discover its first line of defense at the 78.6% Fibonacci retracement level at $0.199, then at the September 26 low at $0.193.
An additional foothold may arise at the local bottom, at $0.186, before Dogecoin price tags the lower boundary of the prevailing chart pattern at $0.176.
Investors should note that if DOGE falls below the downside trend line of the parallel channel, an ultimate bearish narrative of a 22% downswing toward $0.137 may be unraveled for Dogecoin price, a pessimistic target given by the channel.
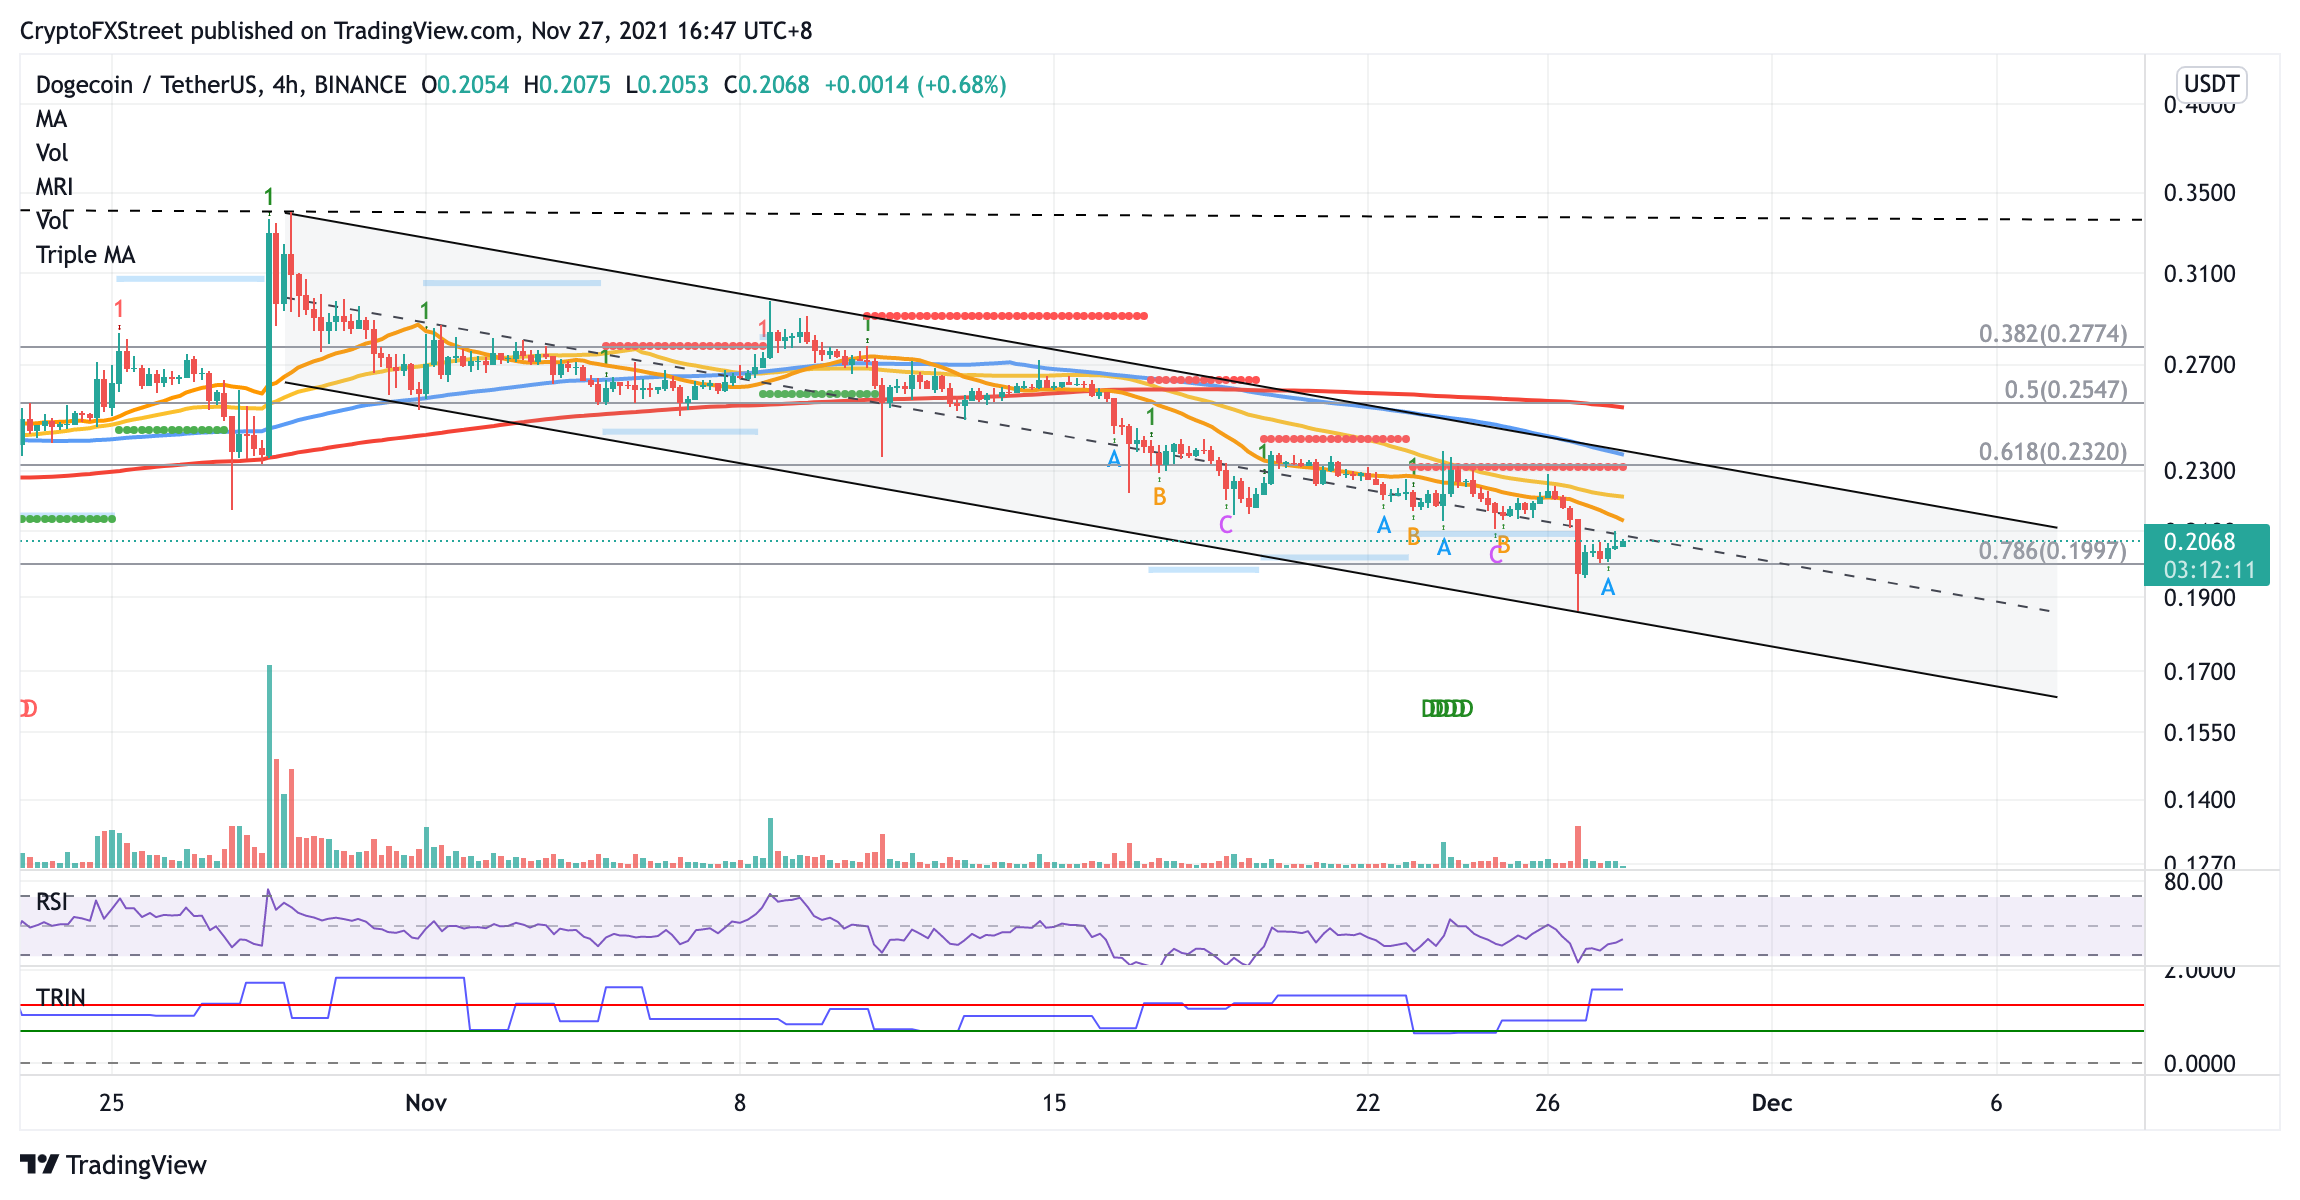
DOGE/USDT 4-hour chart
To reverse the period of sluggish performance, DOGE bulls should aim to slice above the middle boundary of the prevailing chart pattern at $0.208. Additional resistances may appear at the 21 four-hour Simple Moving Average (SMA) at $0.213, then at the 50 four-hour SMA at $0.221.
Another stiff hurdle may emerge at the 61.8% Fibonacci retracement level at $0.232, coinciding with the resistance line given by the Momentum Reversal Indicator (MRI) and the upper boundary of the parallel channel.
Escaping above the topside trend line of the governing technical pattern could see the meme token’s momentum shift to the upside, potentially targeting bigger aspirations. However, Dogecoin price must also overcome the 100 four-hour SMA at $0.236 and the 200 four-hour SMA which intersects with the 50% retracement level at $0.254 for an attempt to recuperate recent losses.
Author

Sarah Tran
Independent Analyst
Sarah has closely followed the growth of blockchain technology and its adoption since 2016.


