Dogecoin Price Forecast: DOGE whale transactions fell by more than 70%; bearish move ahead
- Dogecoin price continues to trade lower to $0.24 after falling more than 7% the previous week.
- The technical outlook suggests a further correction as RSI and MACD indicators signal bearish divergences.
- Santiment data shows that DOGE whale transactions are falling, indicating weakness.

Dogecoin (DOGE) continues to trade down around $0.24 after falling more than 7% in the previous week. The technical outlook suggests a further correction as DOGE’s momentum indicators reflect bearish divergences. Santiment data show that DOGE whale transactions are falling, indicating signs of weakness.
Dogecoin whale activity has fallen off a cliff
Dogecoin price has fallen more than 30% since mid-January and continues to edge down. According to Santiment data, DOGE whale transactions have also declined with its price.
The graph below shows that DOGE’s $100K+ weekly whale transactions have declined from 20,200 to 6,200 since early November. Moreover, more than $1 million in weekly transactions have also fallen from 3,490 to 850 during the same period, indicating weakness in whale accumulation.
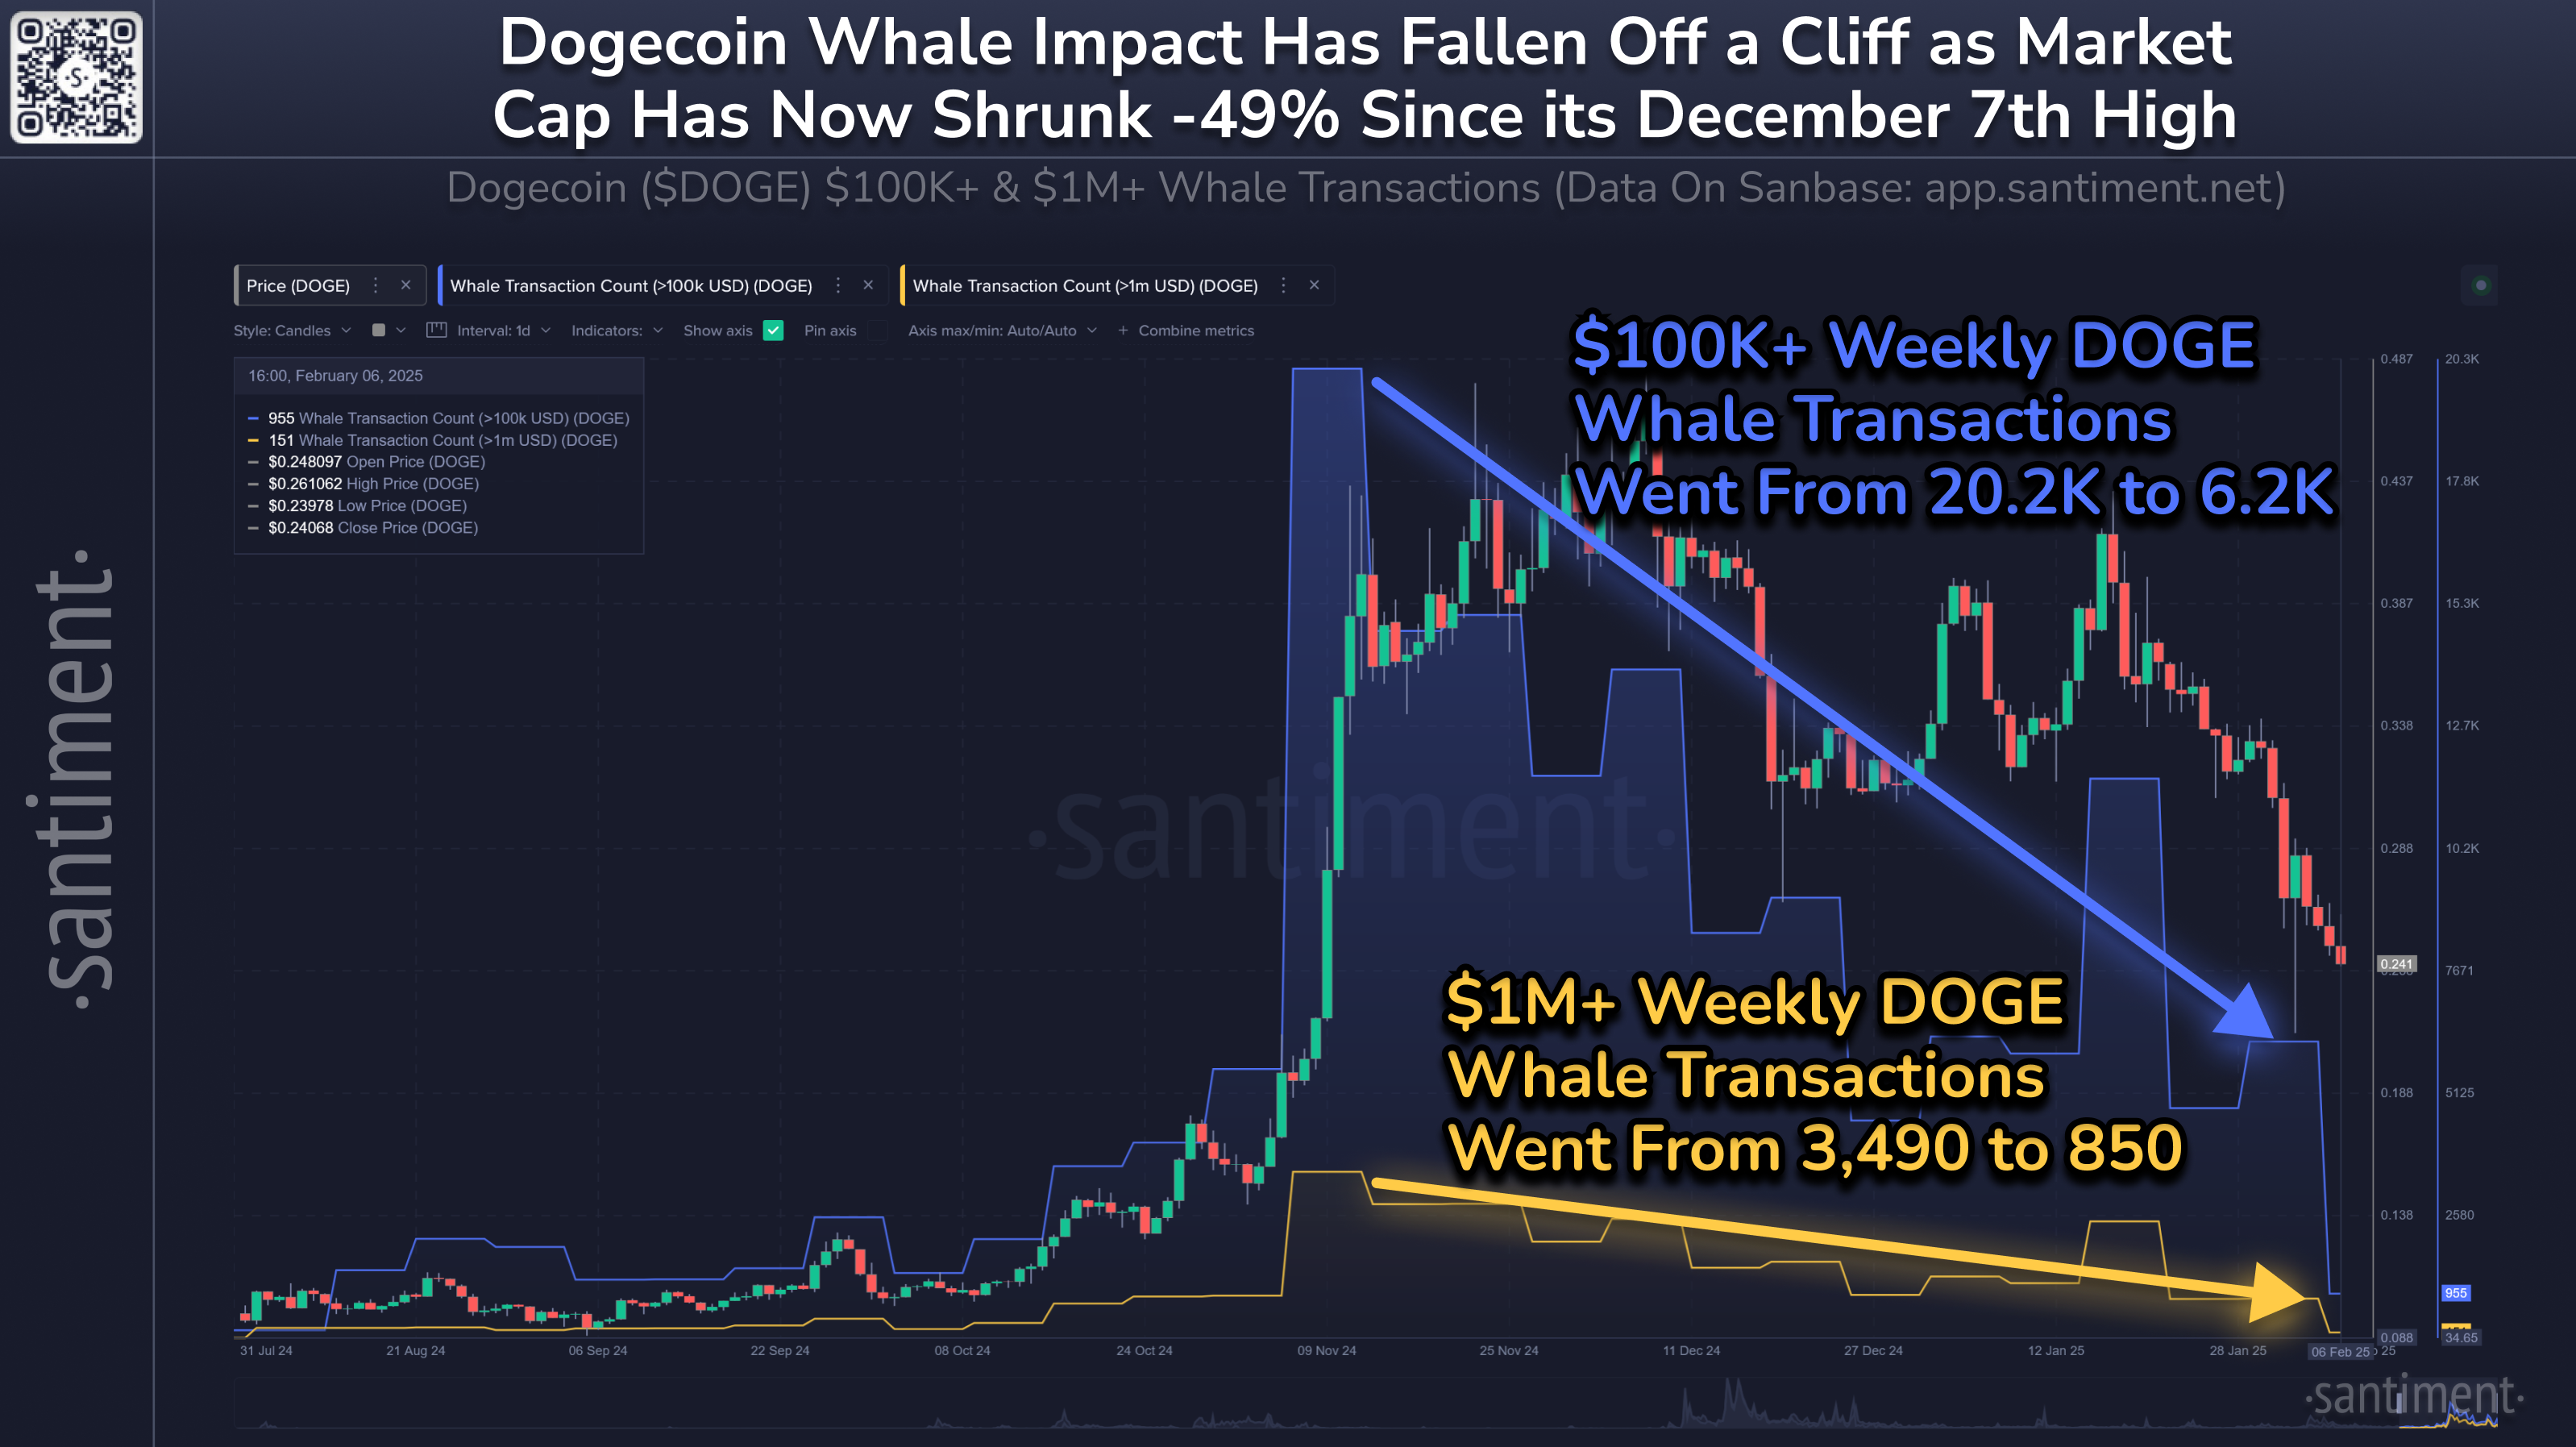
Doge weekly whale transactions chart. Source: Santiment
Dogecoin technical outlook: Momentum indicators show a bearish move ahead
Dogecoin’s weekly chart declined 7.15% last week, closing below its 50% price retracement level (drawn from an August 14 low of $0.05 to a December 2 high of $0.48) at $0.27. At the start of this week on Monday, it hovers around $0.24.
If DOGE continues to decline, it could extend the correction to retest its weekly support at $0.18.
The Relative Strength Index (RSI) indicator on the weekly chart reads 48, below its neutral level, indicating a rise in bearish momentum. Moreover, the Moving Average Convergence Divergence (MACD) indicators also show a bearish crossover on the weekly chart, suggesting a continuation of the downward trend.
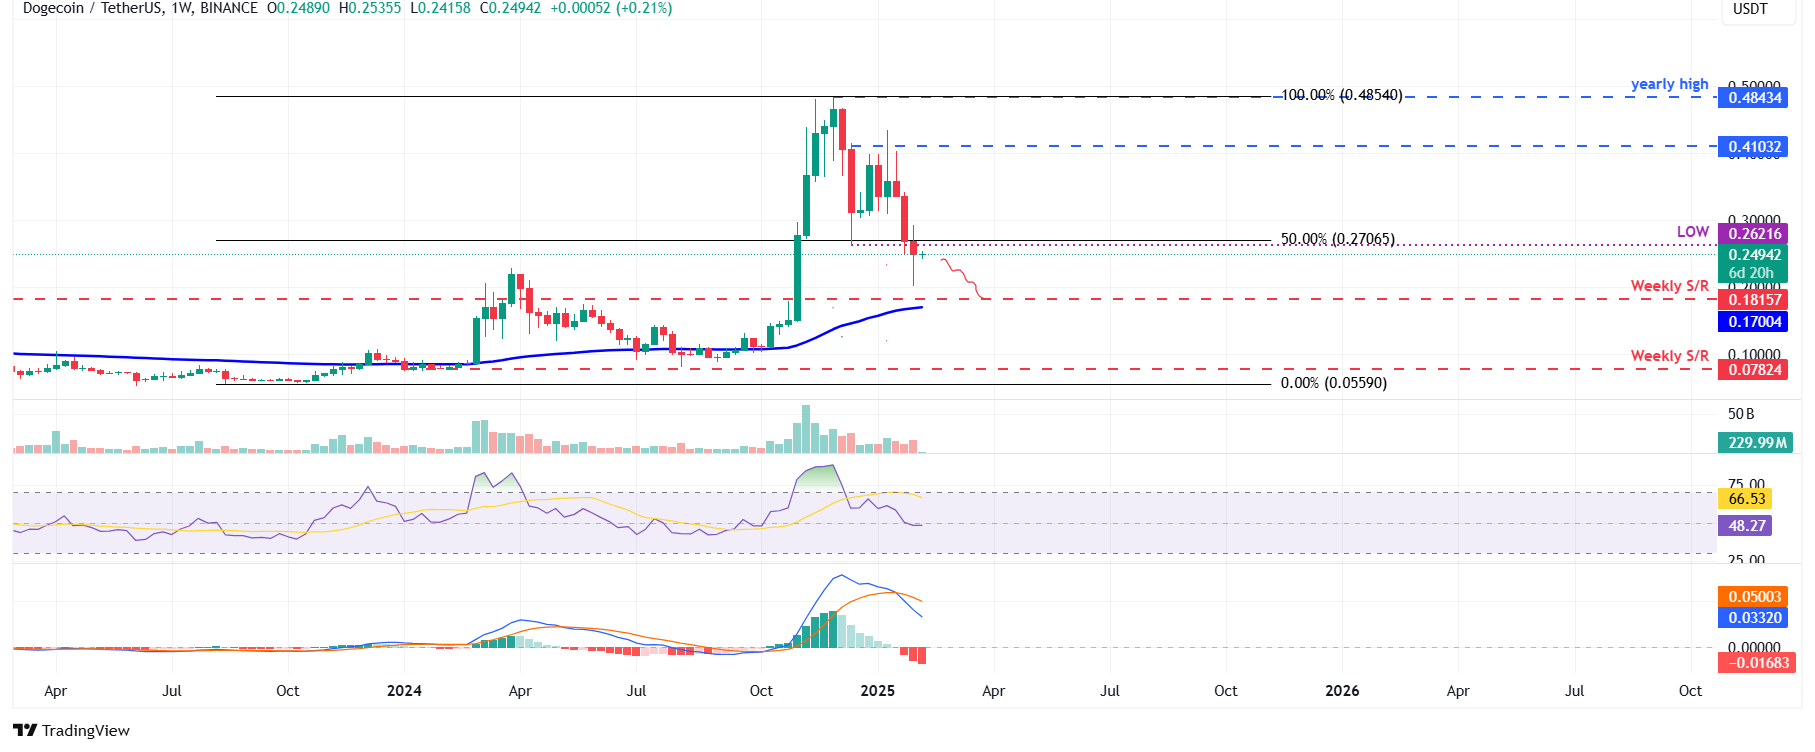
DOGE/USDT weekly chart
Author

Manish Chhetri
FXStreet
Manish Chhetri is a crypto specialist with over four years of experience in the cryptocurrency industry.


