Dogecoin price consolidation is bullish, projecting another rally high
- Dogecoin price illustrating a pennant continuation pattern on 1-hour chart.
- DOGE market capitalization now exceeds Bitcoin Cash, Cardano, and Polkadot.
- Volume profile shows no one is running for the exits.

Dogecoin price is currently attempting to break out from a pennant pattern on the 1-hour chart, but volume is not complementing the attempt. A retest of the pennant’s upper trendline at $0.327 may be coming. However, two successful tests of the 38.2% Fibonacci retracement of the rally from the April 11 breakout to today’s high points to speculators still looking to buy on weakness.
Dogecoin price explosion beyond a social media narrative
The number of new addresses created this week has now surpassed the January high, showing increasing interest in participating in the DOGE rally. Still, it also indicates that the bullish anthem might have traveled too far, too fast, creating bubble-like conditions.
It is not a sign of a top, but a warning to all speculators to be agile and disciplined with their entries and exits at this moment in the rally phase.
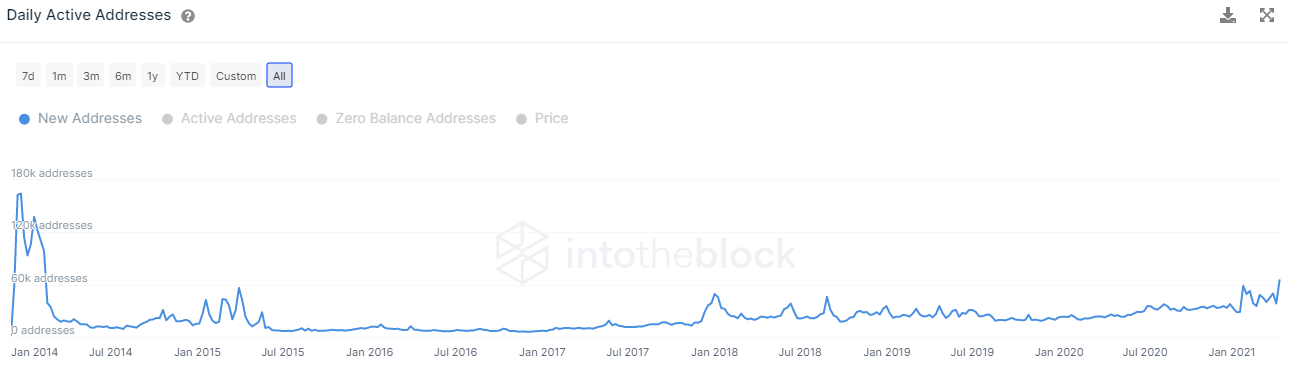
DOGE New Addresses via Intotheblock
A spike in volume accompanying a breakout is the ideal scenario in technical analysis; it shows commitment and emotion. The current breakout from a pennant pattern has yet to attract the commitment, but it is not a red flag and could signal that a more complex consolidation could unfold.
Key to the bullish narrative outlined here is if the 38.2% retracement level holds on an hourly closing basis. A close below will raise the probability that the rally high has been printed.
The first upside target is the all-time high at $0.453, followed closely by the psychologically important $0.500. Bigger rally aspirations should target the 161.8% extension of today’s intra-day pullback at $0.551 and even the 261.8% extension at $0.709.
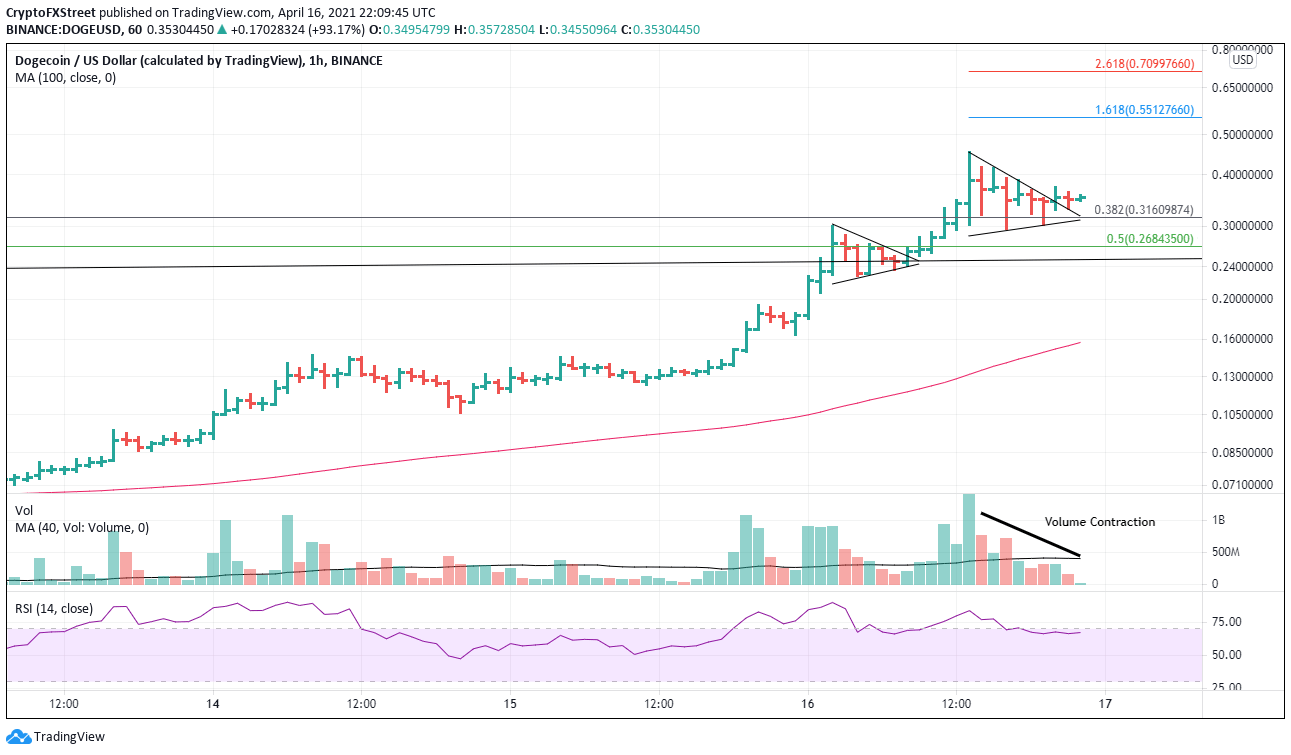
DOGE/USD 1-hour chart
An hourly close below the 38.2% retracement level mentioned above would signal an immediate test of the 50% retracement at $0.268 and confirm that the high has been printed for the explosive advance.
Author

Sheldon McIntyre, CMT
Independent Analyst
Sheldon has 24 years of investment experience holding various positions in companies based in the United States and Chile. His core competencies include BRIC and G-10 equity markets, swing and position trading and technical analysis.



