Dogecoin killer Shiba Inu smahses resistance while SHIB bulls push for $0.000014
- Shiba Inu price rocket launches higher, moving over 52% from the October open.
- Bullish breakout hits previously traded highs.
- Bearish divergence triggers a warning that current upside potential may be limited.

Shiba Inu price has made some substantial gains since its October open at $0.00000716. A gain of over 52% has seen bulls push Dogecoin killer Shiba Inu to new four-month highs at 0.000011. However, persistent historical resistance has prevented further upside movement.
Shiba Inu price hits $0.000011; sellers look to take control if daily close is below $0.0000091
Shiba Inu price has outperformed most of the cryptocurrency market with its spectacular and explosive bullish momentum since October. Long-term buyers, however, have consistently been vexed against the $0.000009 level. As a result, 0.000009 has acted as the top of a long trading range and has been tested on June 16th, June 30th, July 6th, August 16th, September 16th and October 3rd.
Long and short-term bulls who look for a breakout may have to wait. After shifting the Relative Strength Index to bear market conditions, Shiba Inu price is trading against the final overbought condition in a bear market in the Relative Strength Index (65). The position of the daily Relative Strength Index facing resistance against 65 is a warning that the most immediate move higher is at risk of failing.
Another sign that upside movement may terminate soon is the hidden bearish divergence between Shiba Inu price and the Composite Index. The red arrow on the candlestick chart shows lower highs, while the Composite Index shows higher highs. The Composite Index is also at a level of historical resistance.
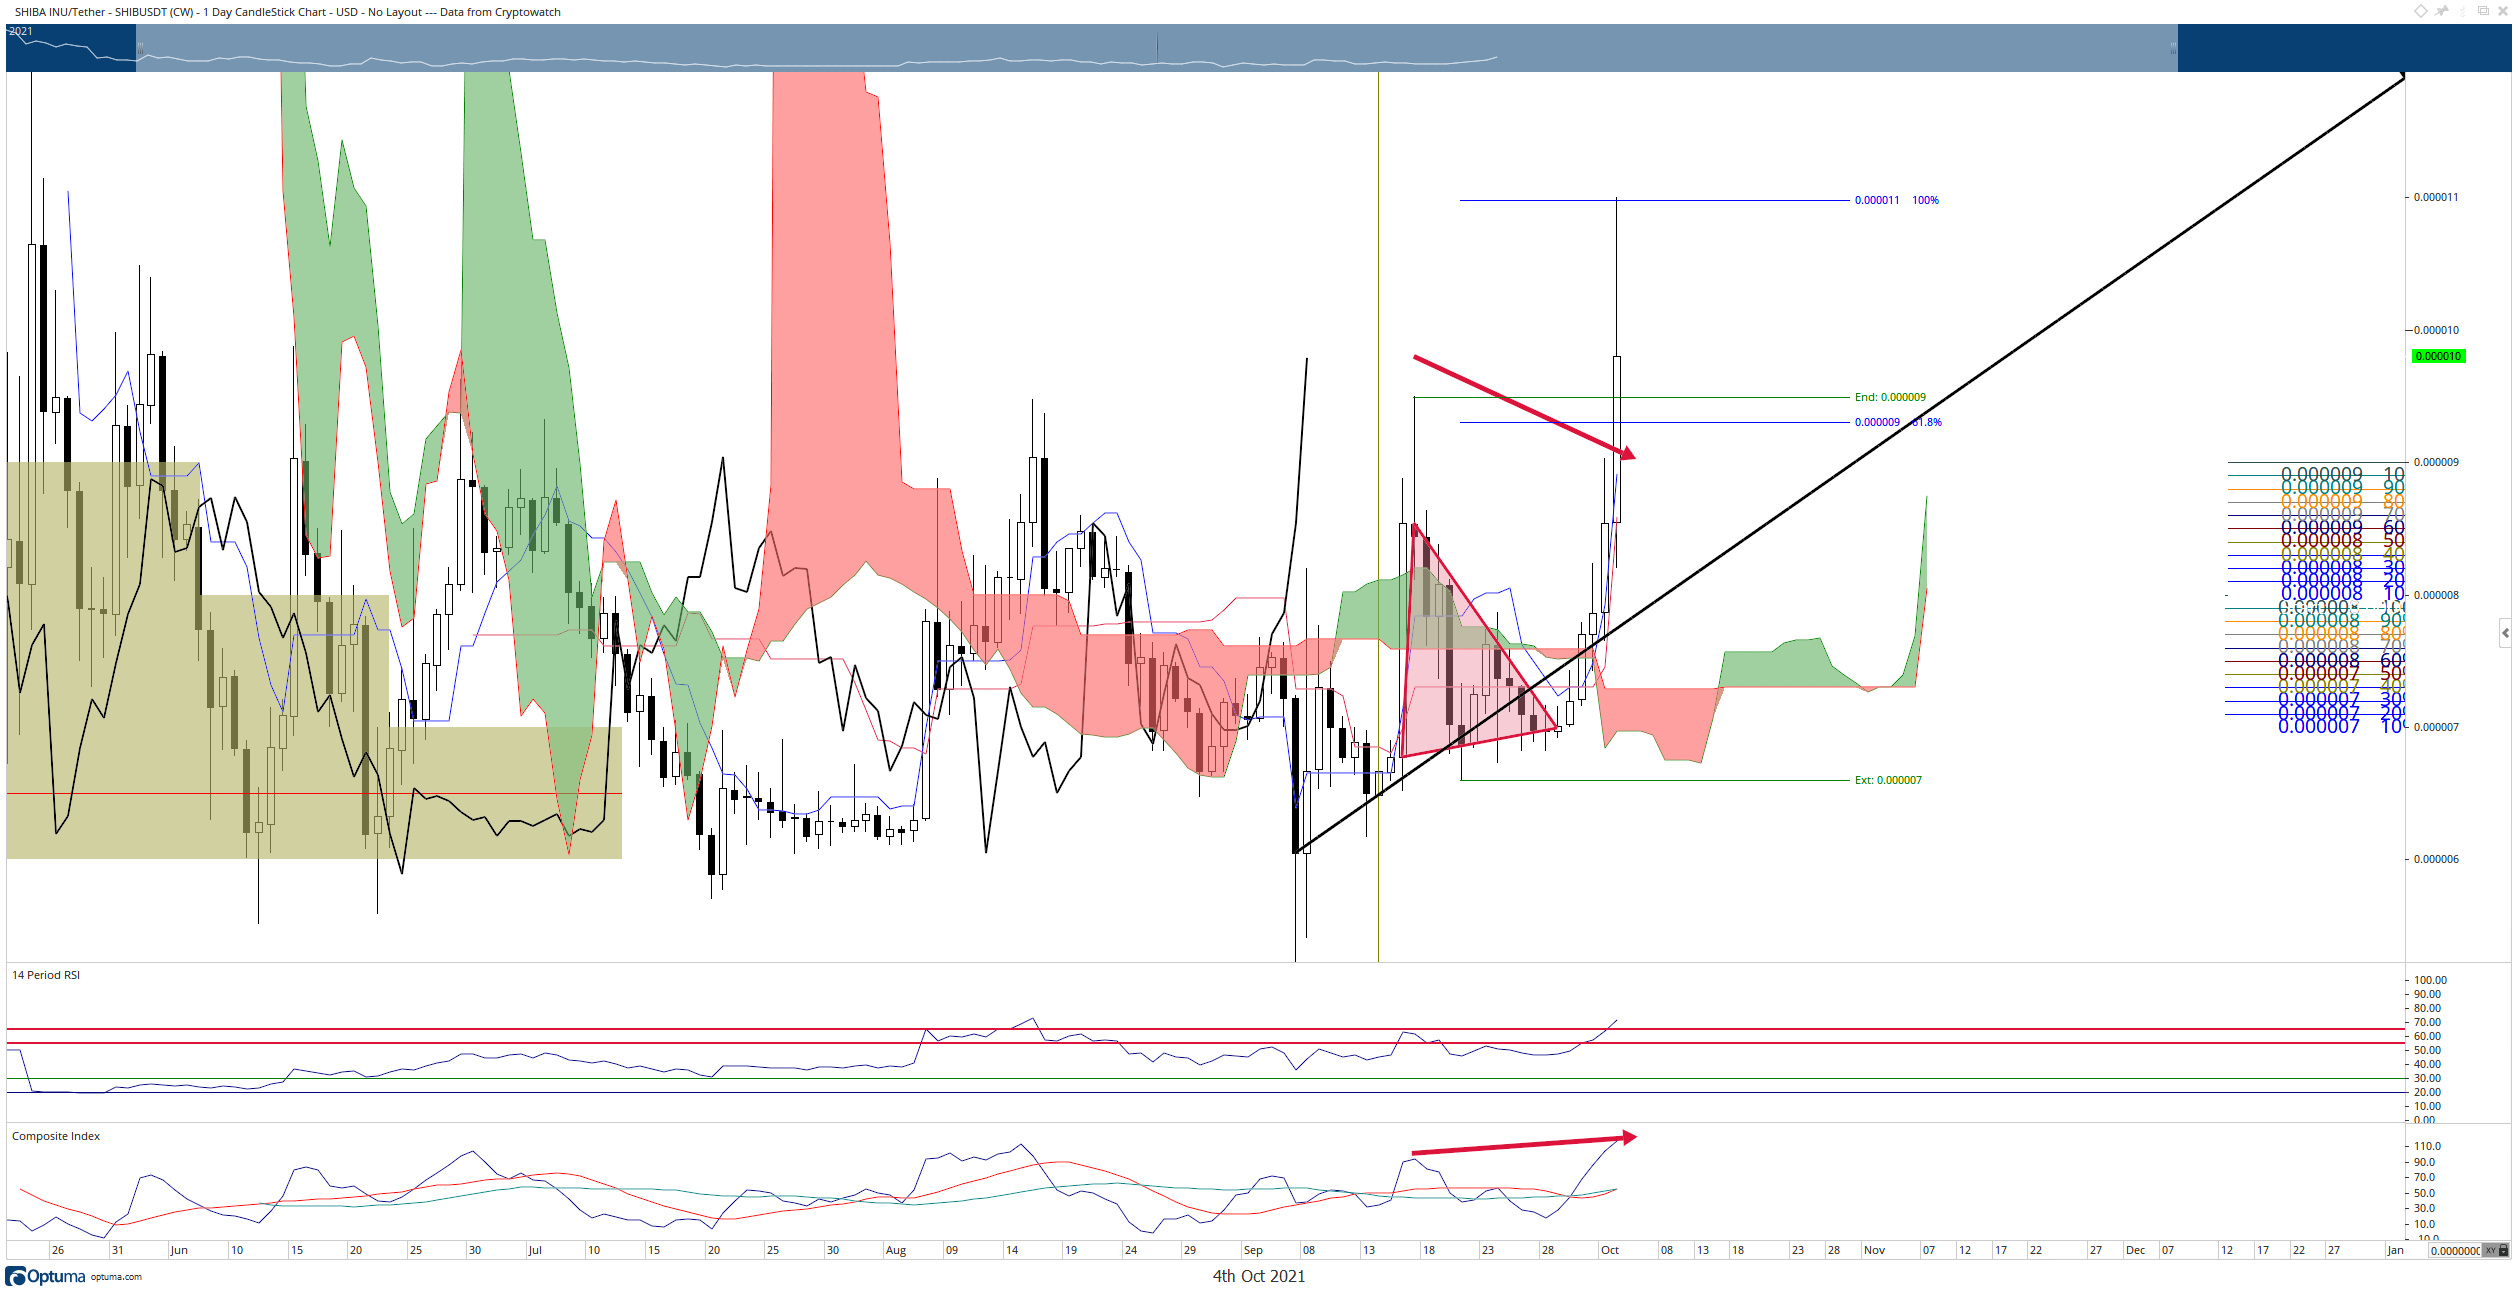
SHIB/USDT Daily Ichimoku Chart
Sellers, however, should be cautious about this trading range. Shiba Inu price may show signs of immediate correction and a return to the $0.000007 value area, but the weekly Relative Strength Index (not shown) shows a return to 50 and a breakout above that level. Thus, if the weekly chart maintains the bullish Relative Strength Index momentum throughout the week, Shiba Inu price could easily close at $0.000011.
Like this article? Help us with some feedback by answering this survey:
Author

Jonathan Morgan
Independent Analyst
Jonathan has been working as an Independent future, forex, and cryptocurrency trader and analyst for 8 years. He also has been writing for the past 5 years.




