|

Dogecoin Elliott Wave technical analysis [Video]

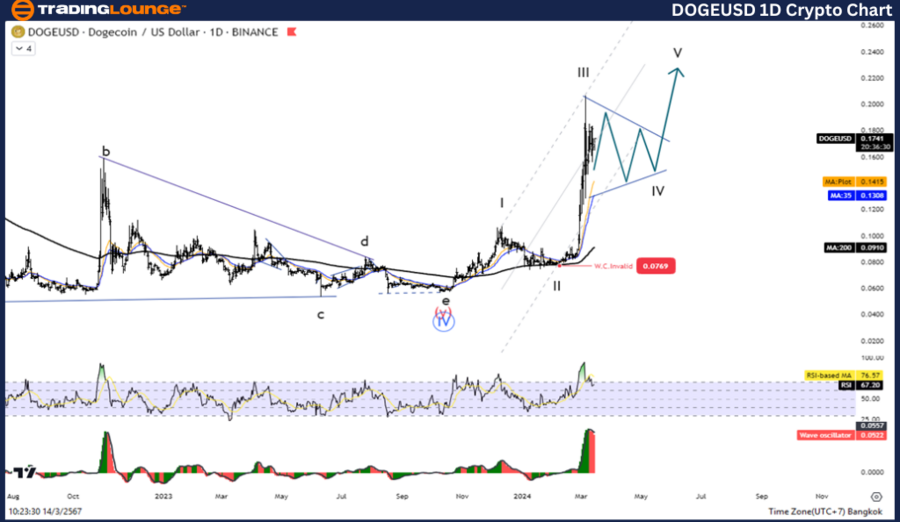
DOGE/USD Elliott Wave technical analysis 

Function: Counter trend.   

Mode: Corrective.

Structure: Zigazg.

Position:  Wave ((C)).

Direction next higher degrees: Wave I of Impulse.

Details: The corrective of Wave 4 before entry to uptrend again.

Dogecoin/ U.S. dollar (DOGEUSD) Trading Strategy: The fourth wave correction is likely to go down to test the 0.1169 level before rising again in the fifth wave. Therefore, the overall outlook is for a short-term pullback to continue rising. Wait for the correction to complete to re-enter the trend.

Dogecoin/ U.S. dollar(DOGEUSD)Technical Indicators: The price is above the MA200 indicating a Downtrend, The Wave Oscillator is a Bearish Momentum.
Chart

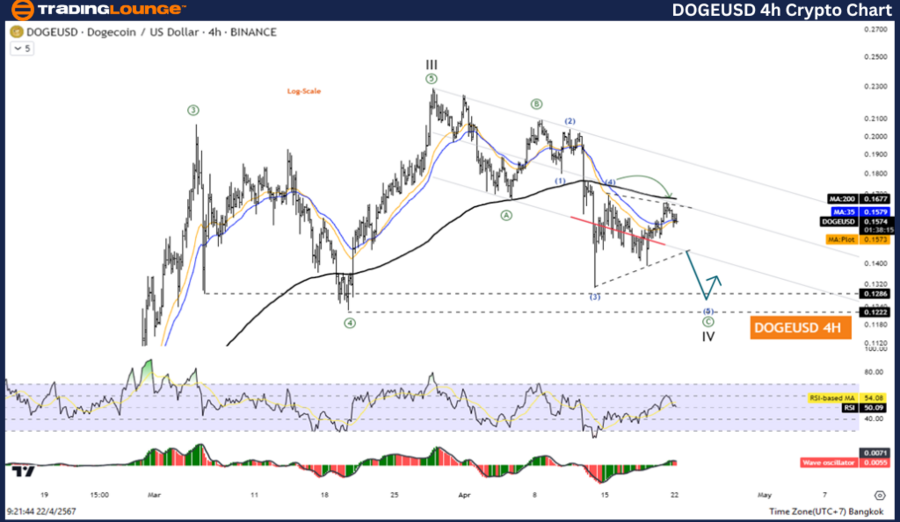
DOGE/USD Elliott Wave technical analysis 

Function: Follow trend.    

Mode: Motive.

Structure:  Impulse.

Position:  Wave (5).

Direction next higher degrees: Wave ((C)) of Zigzag

Details: We missing one Move down in wave 5 before the price entry to Uptrend again   

Dogecoin/ U.S. dollar(DOGEUSD)Trading Strategy: A fourth wave correction came before falling again in the fifth wave. Therefore, the overall picture is a continuous decline. Wait for the correction to complete to re-enter the trend

Dogecoin/ U.S. dollar(DOGEUSD)Technical Indicators: The price is above the MA200 indicating a Downtrend, The Wave Oscillator is a Bearish Momentum.
Chart

Dogecoin Elliott Wave technical analysis [Video]

Author

Peter Mathers

Peter Mathers

TradingLounge

Peter Mathers started actively trading in 1982. He began his career at Hoei and Shoin, a Japanese futures trading company.


More from Peter Mathers
Share:

Editor's Picks

Crypto Overview: Bitcoin remains vulnerable – Venice, Sky extend gains

Bitcoin hovers above $64,000 facing persistent headwinds amid hopes of a potential bullish reversal. Crypto market sentiment shows early signs of shifting away from risk-averse conditions, while Venice Token (VVV) and SKY are leading gains over the past 24 hours.

Top 3 Price Prediction: BTC breaks 50-day EMA, ETH near critical resistance, XRP hints mild recovery

Bitcoin shows early signs of recovery, trading around $63,400 after a 2.9% gain and a close above key resistance earlier this week. Ethereum continues to trade sideways, nearing the upper consolidation range near $1,919, where a close above this level suggests a rally ahead.

Ethereum Price Forecast: Investors remain on the sidelines

Ethereum continued its consolidation pattern over the past week with several key on-chain and derivatives metrics indicating traders remain hesitant to return to the market. The holdings across several wallet cohorts remained largely unchanged over the past week. Wallets holding 10K-100K ETH, also classified as whales, saw modest inflows of only 10K ETH.

SEC proposes 'Regulation Crypto Assets' to clarify fundraising rules for crypto firms
The US Securities and Exchange Commission (SEC) on Tuesday proposed "Regulation Crypto Assets," a new regulatory framework for certain crypto asset investment contracts. The proposal outlines exemptions that would allow eligible issuers to raise capital without registering offerings under the Securities Act.
Bitcoin: Hormuz uncertainty clouds BTC outlook
Bitcoin (BTC) trades around $62,900 at the time of writing on Friday, down over 3% so far this week amid cautious institutional demand and persistent geopolitical uncertainty. While BTC shows signs of stabilization, elevated Oil prices and tensions in the Strait of Hormuz continue to weigh on risk sentiment, keeping the Crypto King’s near-term outlook under pressure.

