DOGE could lose to Cardano as Dogecoin struggles with a four-month-old barrier
- Dogecoin price bounced off the critical support and is on its way to test the resistance at $0.0822.
- DOGE’s falling value and Cardano’s rising prices have led to the difference in their market capitalization falling to just $200 million.
- Traders are currently the most active cohort at the moment after their concentration increased by 191% in the last month.
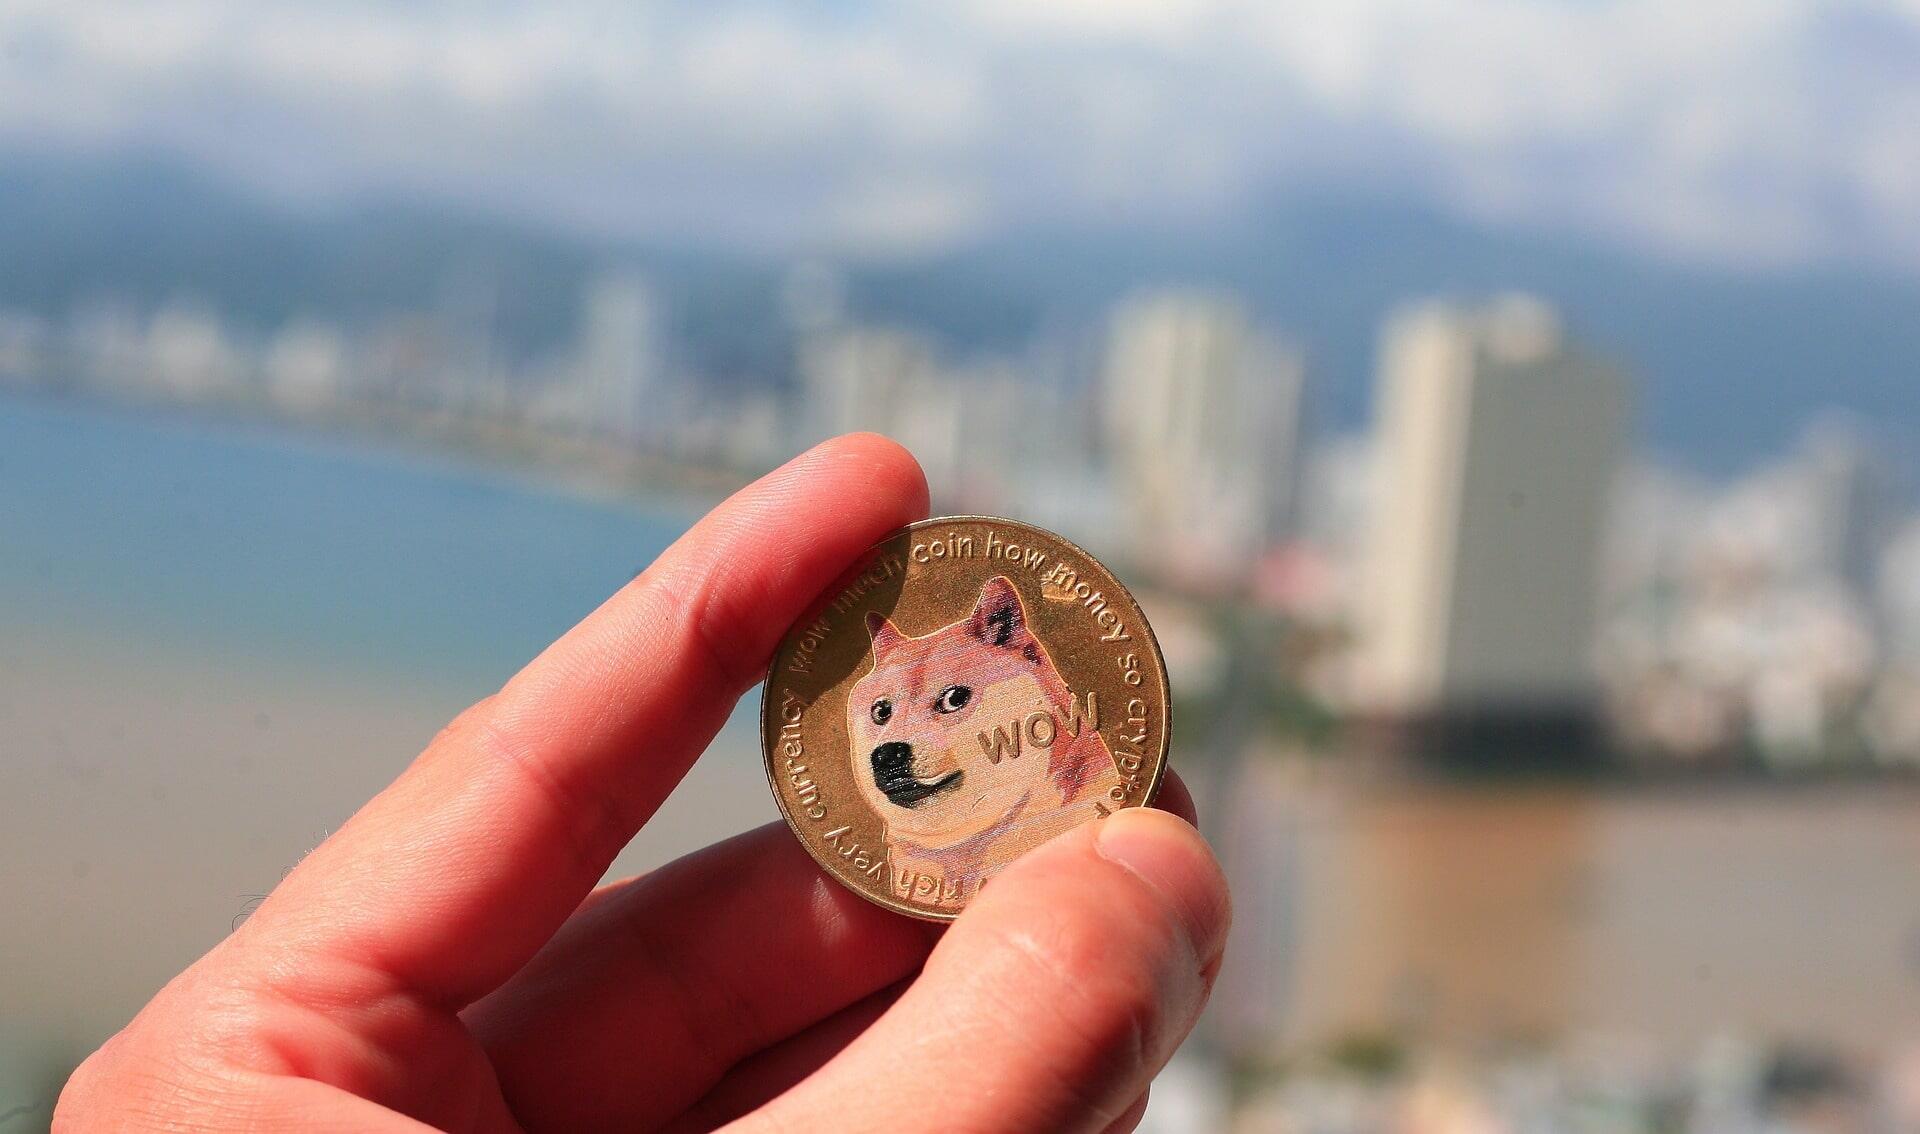
Dogecoin price has not made a splash in quite some time now, and the cryptocurrencies that have, such as Cardano, seem to be making the most of it. The meme coin now stands to lose its spot as the seventh biggest cryptocurrency unless DOGE traders decide to make a big move.
Dogecoin price inches closer to a huge loss
Dogecoin price has been one of the most slow-moving altcoins in the market, both in terms of bearish as well as bullish momentums. This has left the altcoin vulnerable to being taken over by Cardano, whose market capitalization stands only $200 million less than that of Dogecoin.
Over the past couple of days, red candlesticks had been dominating the Dogecoin daily chart, which changed in the last 72 hours as DOGE hit the critical support of $0.0722.
Bouncing off of it, the meme coin regained the 200-day Exponential Moving Average (EMA) as a support line. This is an important development if Dogecoin price aims to breach the four-month-long resistance level of $0.0822. Flipping this barrier into a support floor would enable DOGE to rise further and mark larger gains.

DOGE/USD 1-day chart
The ability to make this happen, however, is in the hands of a particular cohort that has grown in dominance over the past month. Traders (addresses that hold DOGE for less than a month) in the last 30 days have exploded in terms of numbers. Their concentration has increased by 191%, hitting 164K, up from 56K.
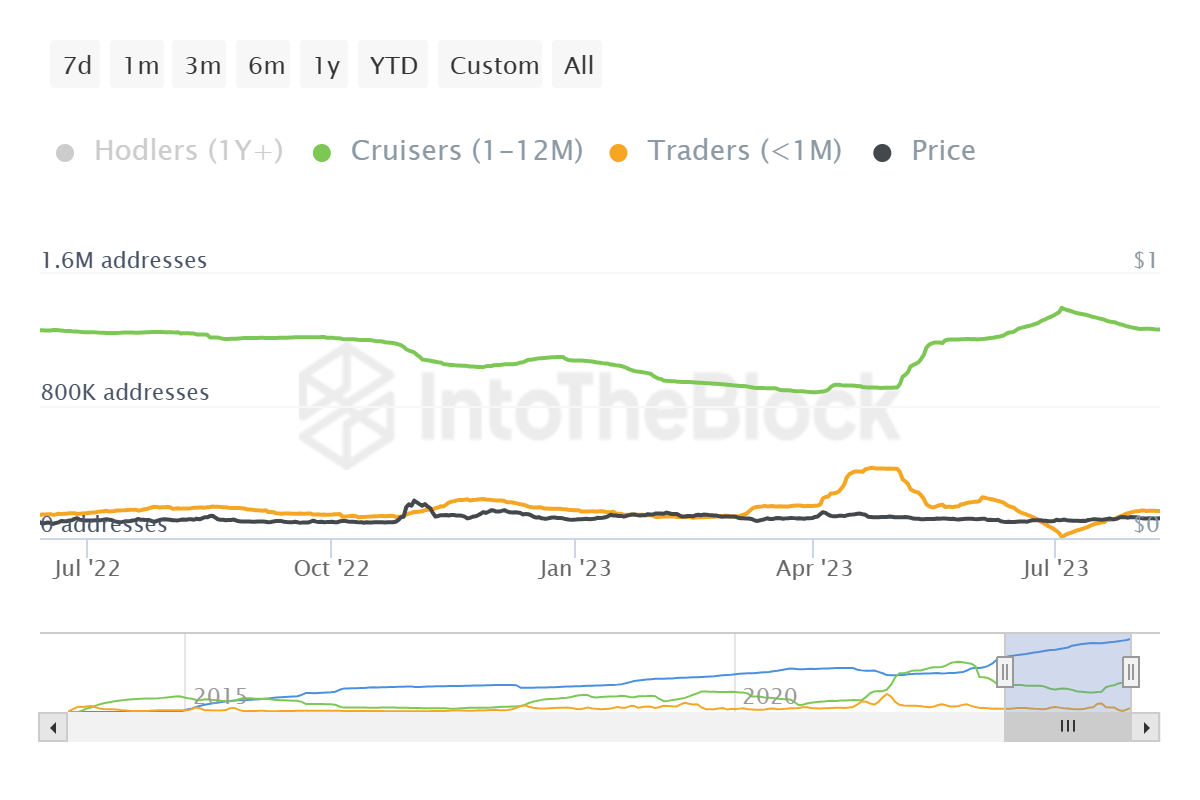
Dogecoin holders' distribution by time
By the looks of it, there is a possibility that these addresses might also be responsible for most of the activity being conducted on the network. The active addresses distributed by profitability highlight that most of the 77% of the active addresses are at the money, i.e., in and around +/- 10% of the market price of the asset.
These are most likely traders that recently bought their DOGE and are moving it around, attempting to either offload it to offset losses or make profits depending on the market conditions. Either way, HODLing is needed from these investors in order to enable the Dogecoin price to rise further.
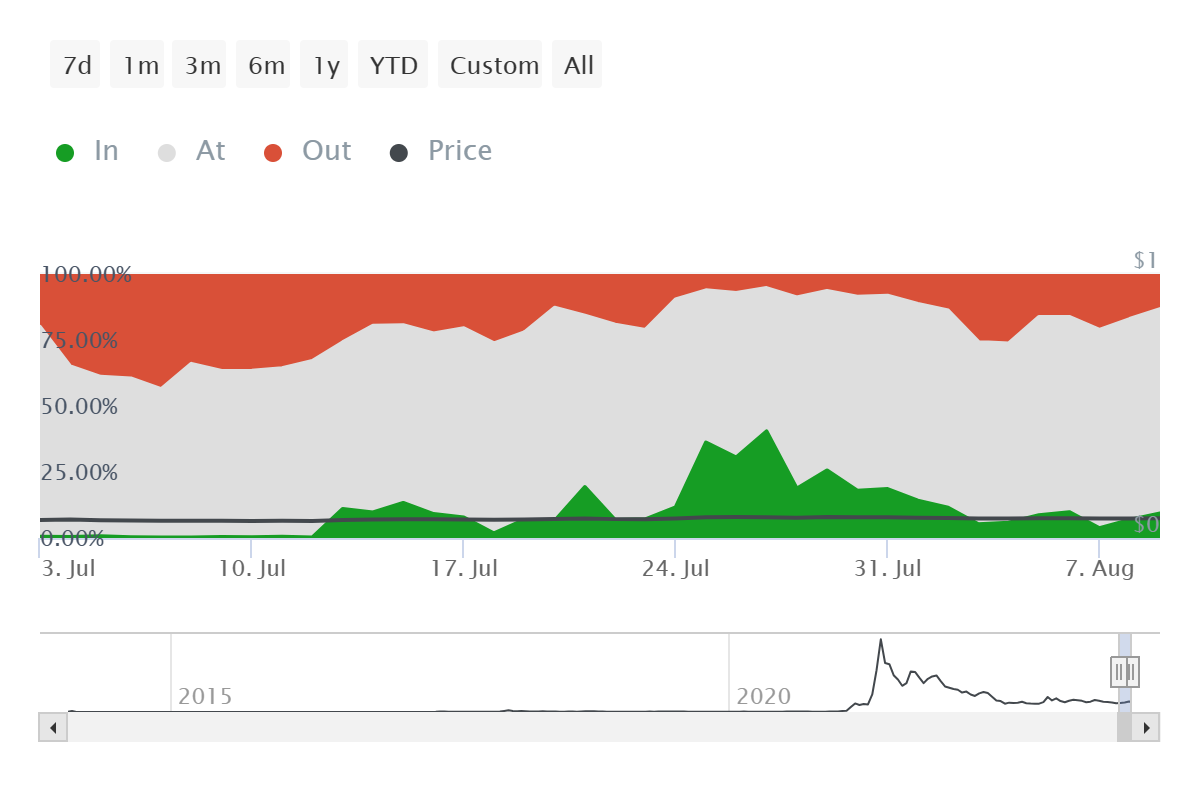
Dogecoin active addresses by profitability
The Relative Strength Index (RSI) and Moving Average Convergence Divergence (MACD) are both indicators pointing towards a potential bullish momentum, provided investors find some stability soon.
Cryptocurrency metrics FAQs
What is circulating supply?
The developer or creator of each cryptocurrency decides on the total number of tokens that can be minted or issued. Only a certain number of these assets can be minted by mining, staking or other mechanisms. This is defined by the algorithm of the underlying blockchain technology. Since its inception, a total of 19,445,656 BTCs have been mined, which is the circulating supply of Bitcoin. On the other hand, circulating supply can also be decreased via actions such as burning tokens, or mistakenly sending assets to addresses of other incompatible blockchains.
What is market capitalization?
Market capitalization is the result of multiplying the circulating supply of a certain asset by the asset’s current market value. For Bitcoin, the market capitalization at the beginning of August 2023 is above $570 billion, which is the result of the more than 19 million BTC in circulation multiplied by the Bitcoin price around $29,600.
What is trading volume?
Trading volume refers to the total number of tokens for a specific asset that has been transacted or exchanged between buyers and sellers within set trading hours, for example, 24 hours. It is used to gauge market sentiment, this metric combines all volumes on centralized exchanges and decentralized exchanges. Increasing trading volume often denotes the demand for a certain asset as more people are buying and selling the cryptocurrency.
What is funding rate?
Funding rates are a concept designed to encourage traders to take positions and ensure perpetual contract prices match spot markets. It defines a mechanism by exchanges to ensure that future prices and index prices periodic payments regularly converge. When the funding rate is positive, the price of the perpetual contract is higher than the mark price. This means traders who are bullish and have opened long positions pay traders who are in short positions. On the other hand, a negative funding rate means perpetual prices are below the mark price, and hence traders with short positions pay traders who have opened long positions.
Like this article? Help us with some feedback by answering this survey:
Author

Aaryamann Shrivastava
FXStreet
Aaryamann Shrivastava is a Cryptocurrency journalist and market analyst with over 1,000 articles under his name. Graduated with an Honours in Journalism, he has been part of the crypto industry for more than a year now.



