Divergence Between Bitcoin’s Bullish PA and Ripple’s Range

BTC/USD
Daily
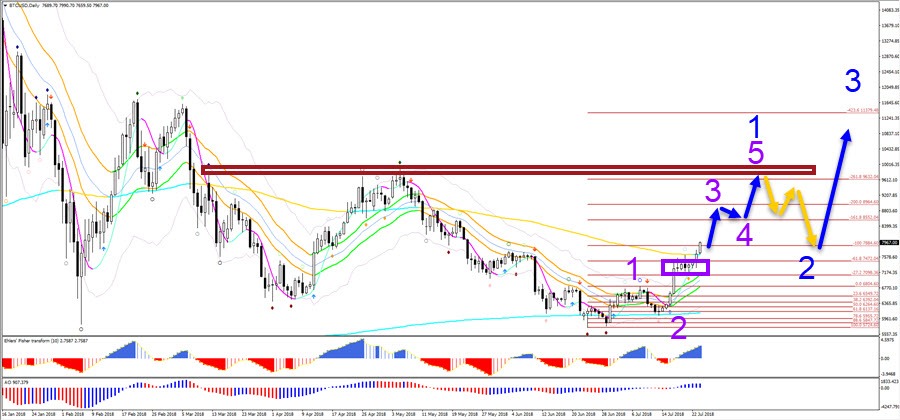
Bitcoin (BTC/USD) is showing strong bullish momentum/price action (PA) after breaking a recent consolidation zone (purple box) but some other altcoins (such as Ripple) seem to be stalling and losing ground relative to Bitcoin. What’s next?

Bitcoin’s price action in the sideways range managed to stay above the 21 EMAs which indicates momentum and impulsive price action. The bullish momentum caused a bullish breakout above the zone and is now showing a continuation towards the Fibonacci targets. BTC/USD should make a bull flag chart pattern eventually (wave 4 purple) and a new high (wave 5 purple) to complete a wave 1 (blue). Then price is expected to correct via an ABC (orange arrows) within a wave 2 (blue).
XRP/USD
Daily
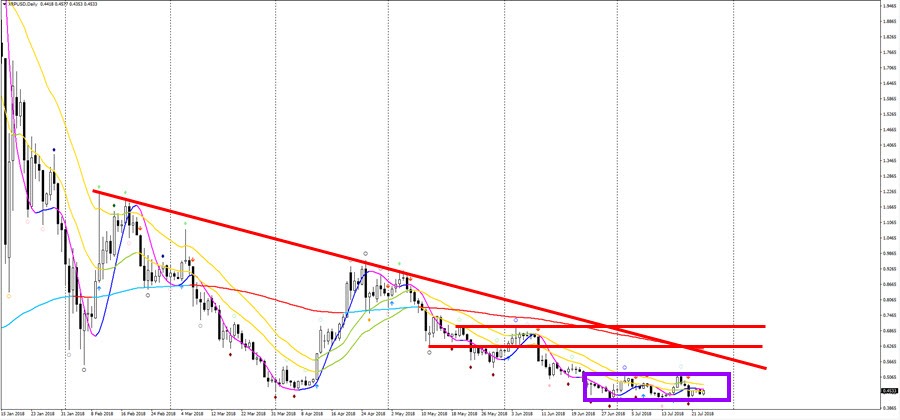
Ripples (XRP/USD) is not showing the same momentum and this is valid for some other crypto currencies as well. The purple box indicates the sideways movement and lack of any momentum, which is why BTC/USD and XRP/USD will keep showing divergence for the near future. It is difficult to imagine XRP/USD breaking above all of the resistance levels without a clear momentum, especially now that BTC/USD is moving up so much. It seems likely that XRP/USD will remain corrective until BTC/USD completes its wave 2 (blue) and starts the wave 3 (blue), which could be so strong that it pulls up the entire altcoin field, including XRP/USD.
4 hour
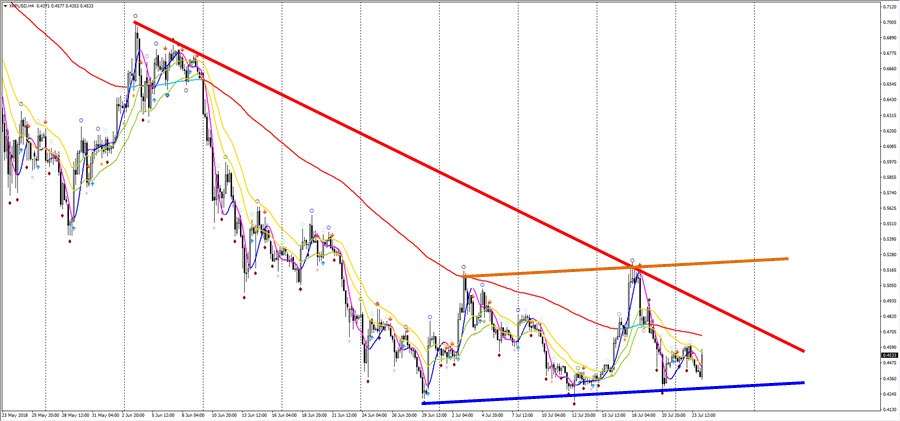
So for the moment we are expecting the divergence between Bitcoin and Ripples to last but eventually, we expect Bitcoin to start such an impulsive wave that it will pull along XRP/USD too.
Author

Chris Svorcik
Elite CurrenSea
Experience Chris Svorcik has co-founded Elite CurrenSea in 2014 together with Nenad Kerkez, aka Tarantula FX. Chris is a technical analyst, wave analyst, trader, writer, educator, webinar speaker, and seminar speaker of the financial markets.


