Despite capturing nearly 2% of Ethereum userbase, Arbitrum’s ARB price is likely to crash 10% soon
- Arbitrum price shows weakness as it trades around the $1.17 level.
- The four-hour chart shows ARB hovers above a key support level, a breakdown of which could trigger a 10% descent to $1.054.
- On the other hand, a bounce above the range low at $1.165 followed by a flip of the range’s midpoint, will invalidate the bearish thesis.

Arbitrum price trades close to a critical support level, a breakdown of which could lead to a steep correction. ARB bulls have one chance to take control and push the market value higher, but considering the overall market structure and the US Consumer Price Index (CPI) announcement on August 10, things could turn in favor of Bitcoin price. So buyers have a chance to seize control, but as mentioned, a failure to recover could help the bears.
According to the on-chain data analytics platform, about 1.81% of Ethereum users are on the Arbitrum Layer 2 chain. Despite such massive success in a short period of time, the altcoin has fallen prey to the bear market outlook.
Also read: Arbitrum price stagnancy leads to loss of traction despite unique addresses doubling in Q2 2023
Arbitrum price needs to hold above this level
Arbitrum price has been trading between the $1.165 and $1.335 range for nearly a month. While ARB breached the range low at $1.165 on July 31 and traded below it for a week, it recovered inside the range. The Layer 2 token needs to stay inside this range to scale higher, but considering the overall crypto market outlook, it looks unlikely.
The Relative Strength Index (RSI) and the Awesome Oscillator (AO) are both showing signs of exhaustion around the overbought zone. Hence, the chances of a breakdown of the range are high. A daily candlestick close below $1.165 will confirm the presence of sellers and potentially trigger a 10% crash to $1.054, resting below which is sell-side liquidity.
So a sweep of the $1.054 level seems plausible on the breakdown of the $1.165 level.
In dire cases, Arbitrum price could revisit the $1.015 level, bringing the total loss from 10% to 13%.
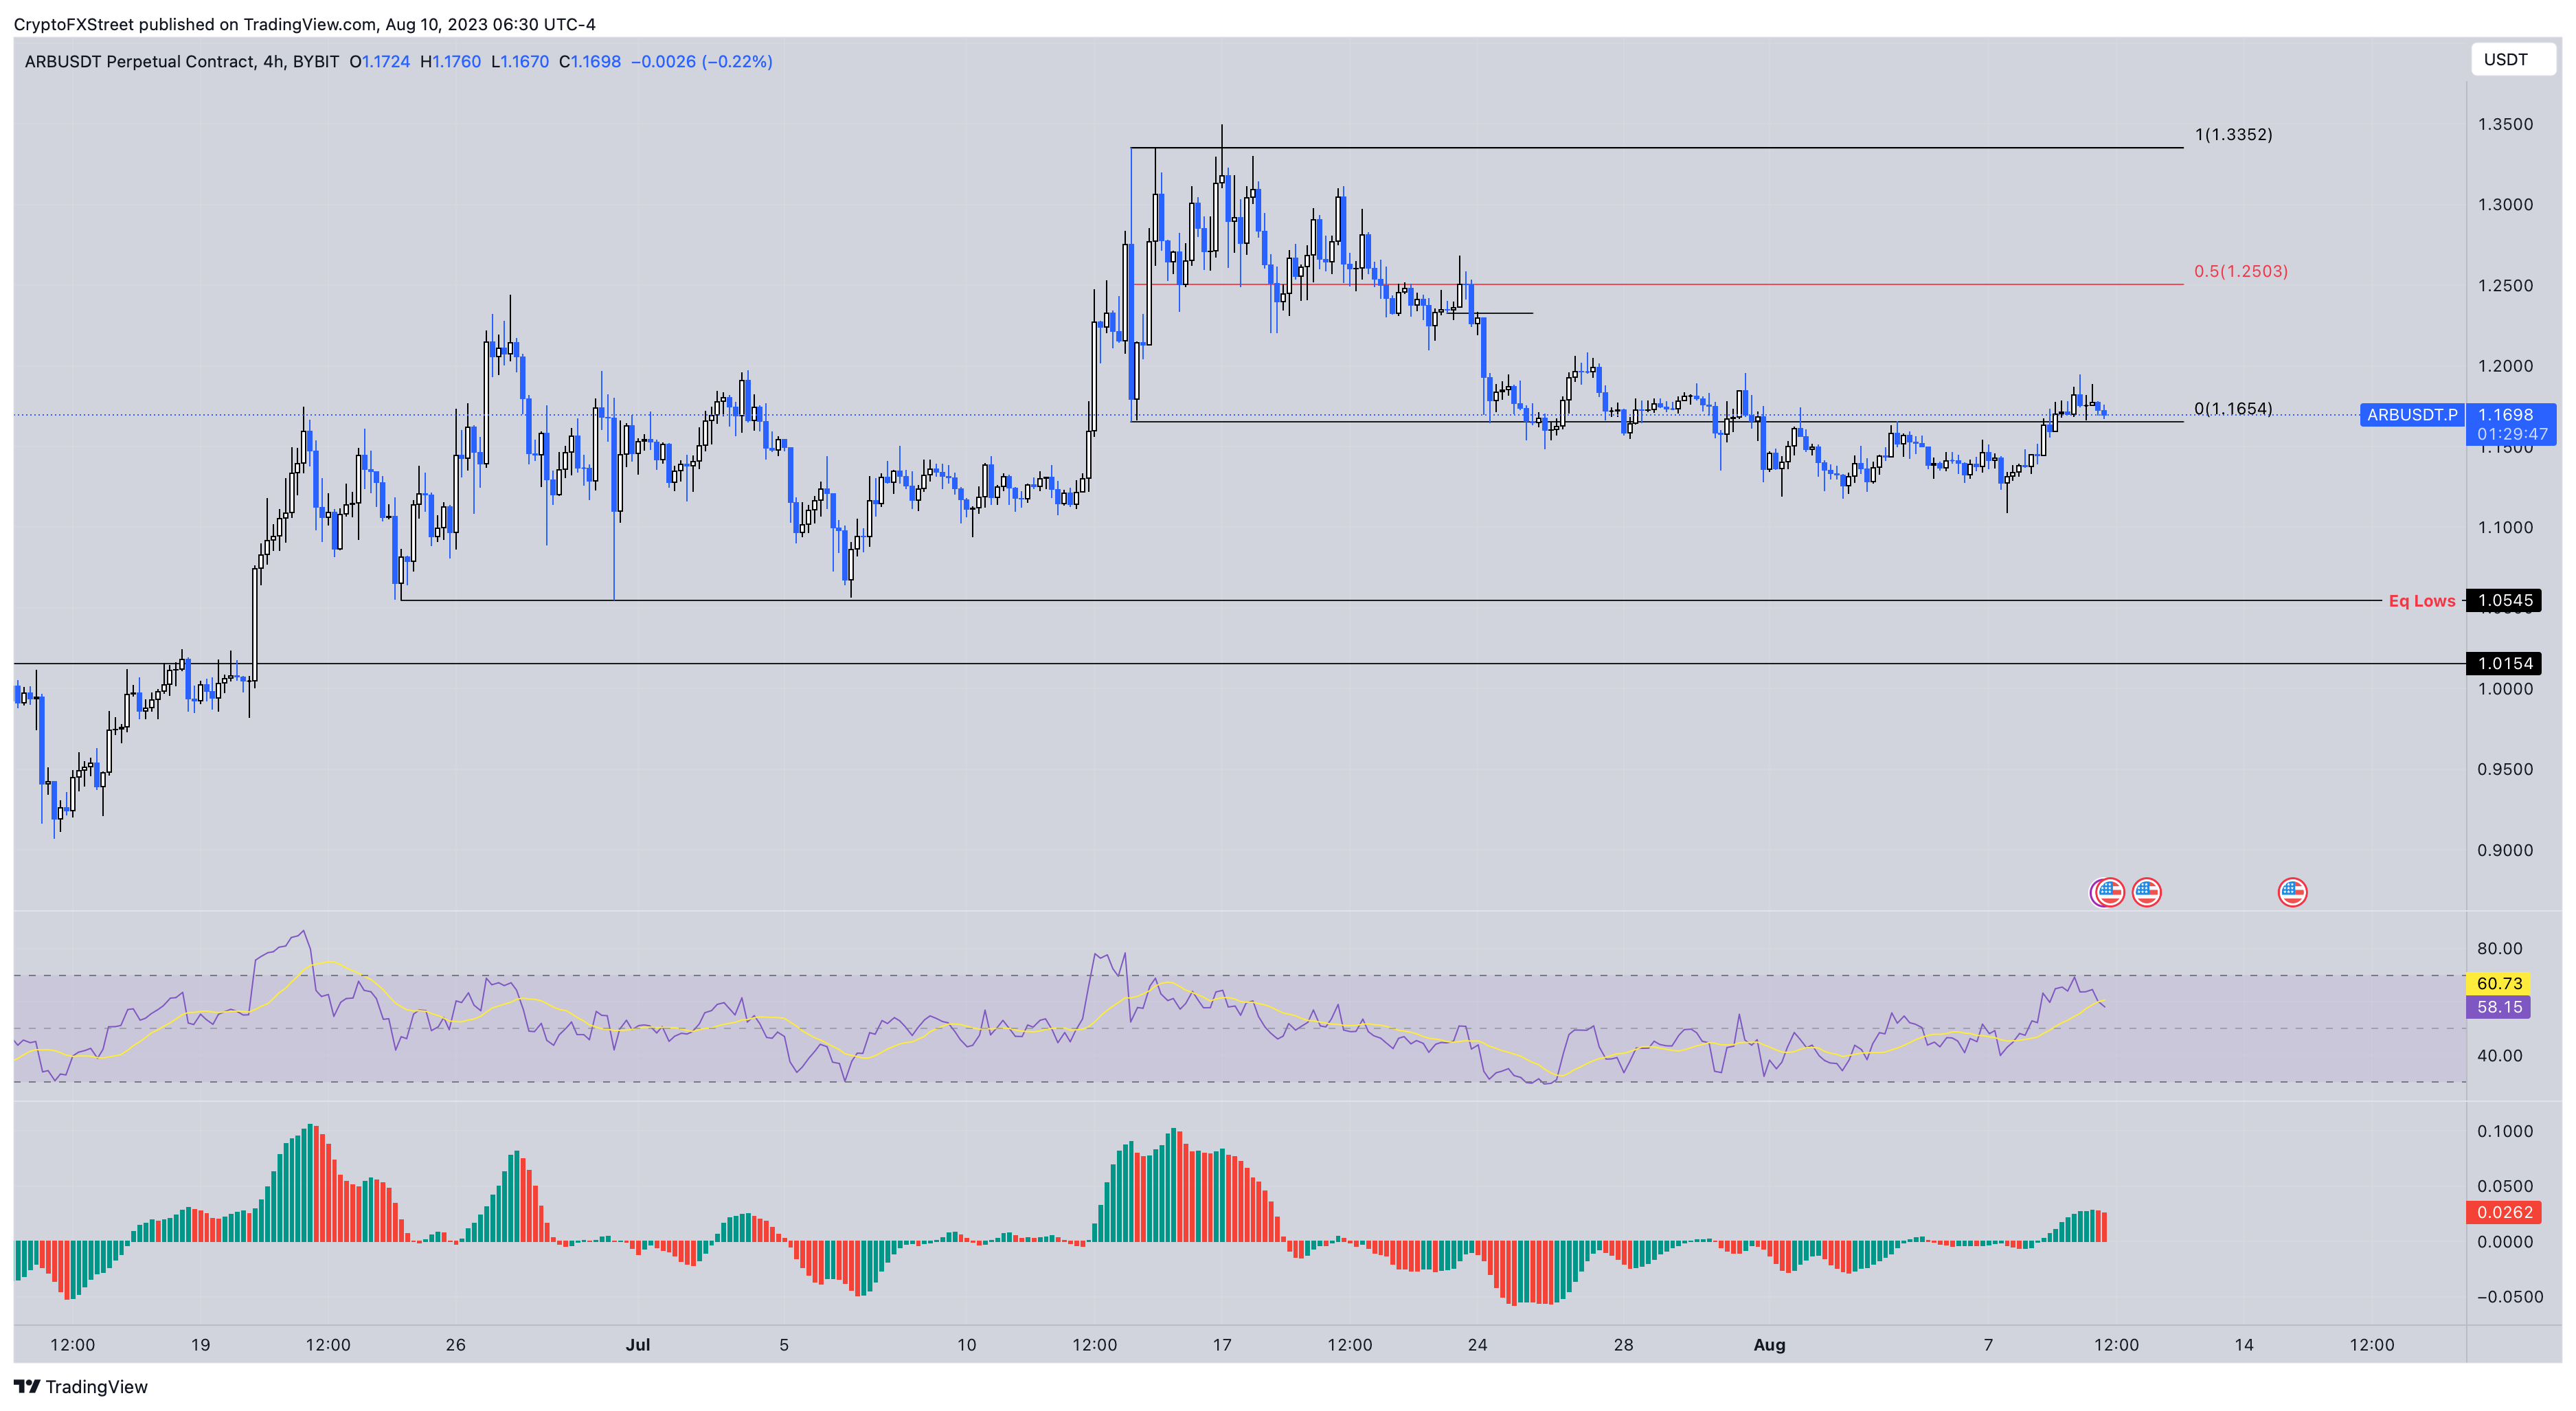
ARB/USDT 4-hour chart
On the other hand, if Arbitrum price fails to breach the $1.165 level, it would indicate a lack of bearish momentum. In such a case, a reset of the RSI and AO around their respective mean levels, would be required for ARB to move higher.
In such a case, investors can expect Arbitrum price to retest the range’s midpoint at $1.250.
Also read: MATIC, ENS, ARB look ready to plummet as traders lose interest on CEX tokens
Like this article? Help us with some feedback by answering this survey:
Author

Akash Girimath
FXStreet
Akash Girimath is a Mechanical Engineer interested in the chaos of the financial markets. Trying to make sense of this convoluted yet fascinating space, he switched his engineering job to become a crypto reporter and analyst.




