DASH/USD bulls take over the market - Technical Analysis
- DASH/USD bulls take over the market as the price sees a jump by 4% from $80.50 to $84.
- Bulls have the chance to break past resistance at $87.50 which has not been breached in over a month.

DASH/USD bulls have taken over the market as the price sees a jump by 4% from $80.50 to $84. If the uptrend continues, then DASH/USD can break past resistance at $87.50 which has not been breached in over a month.
DASH/USD daily chart
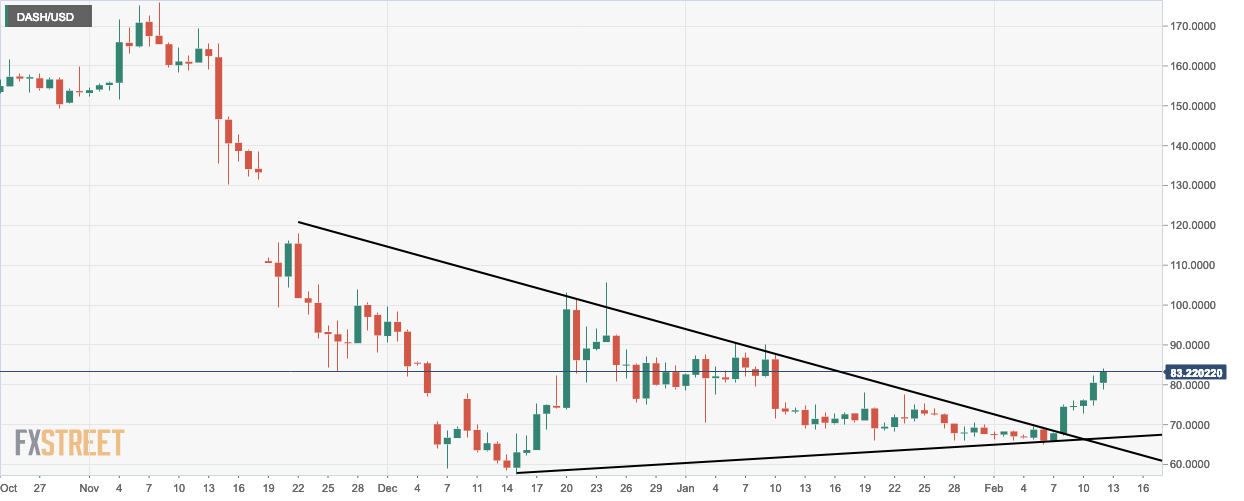
- Daily chart sees a bullish breakout from the triangle formation.
DASH/USD 4-hour chart
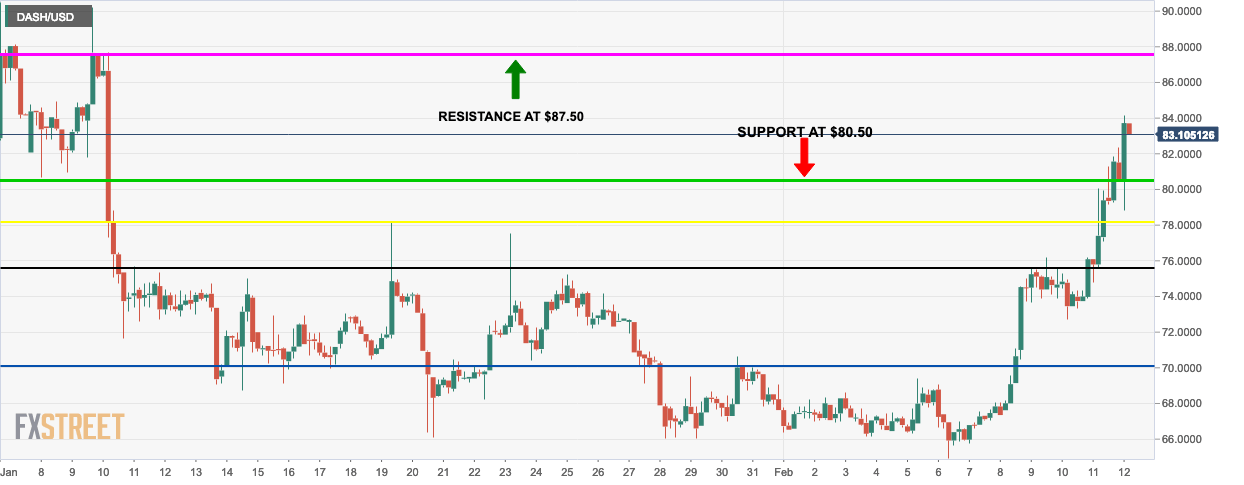
- Bulls breached past $80.50 resistance and carried enough momentum to move towards the $87.50 resistance line.
- The bears took over in the last session and stalled the upward momentum.
DASH/USD hourly chart
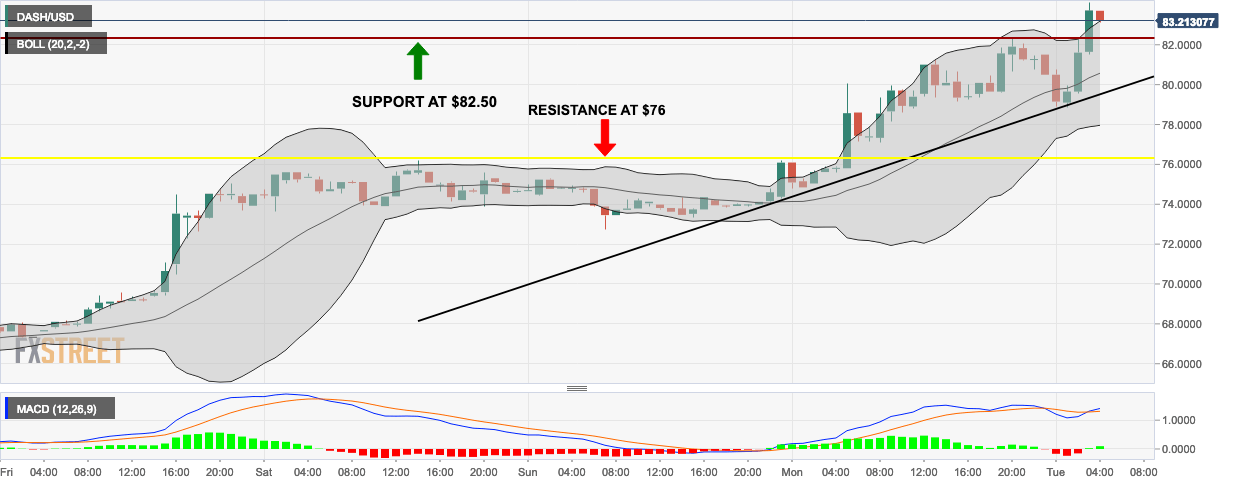
- The last two sessions are floating above the 20-day Bollinger band which shows a bullish market despite the previous session being bearish.
- The moving average convergence/divergence (MACD) indicator shows a bullish market.
Key Levels
- Resistance 3: $91.2184
- Resistance 2: $86.7976
- Resistance 1: $83.6480
- Pivot Point: $79.2272
- Support 1: $76.0776
- Support 2: $71.6568
- Support 3: $68.5072
Author

Rajarshi Mitra
Independent Analyst
Rajarshi entered the blockchain space in 2016. He is a blockchain researcher who has worked for Blockgeeks and has done research work for several ICOs. He gets regularly invited to give talks on the blockchain technology and cryptocurrencies.
More from Rajarshi Mitra


