|

DASH Price Prediction: DASH targets $120 amid inverse head-and-shoulders breakout

  • DASH/USD’s path of least resistance appears north. 
  • Inverse head-and-shoulders breakout confirmed on the 1H chart.
  • Bullish crossover and RSI back the case for additional upside.

Dash (DASH/USD) bulls take a breather just under the $110 level after the renewed uptick.  

Dash, one of the top 50 widely traded crypto assets, adds 12% over the past 24 hours, although is poised to end this rollercoaster week in the red zone.

In the second half of the week, the DASH bulls regained control, looking to extend the recovery mode into Saturday.

DASH: Bulls back in command amid favorable technicals

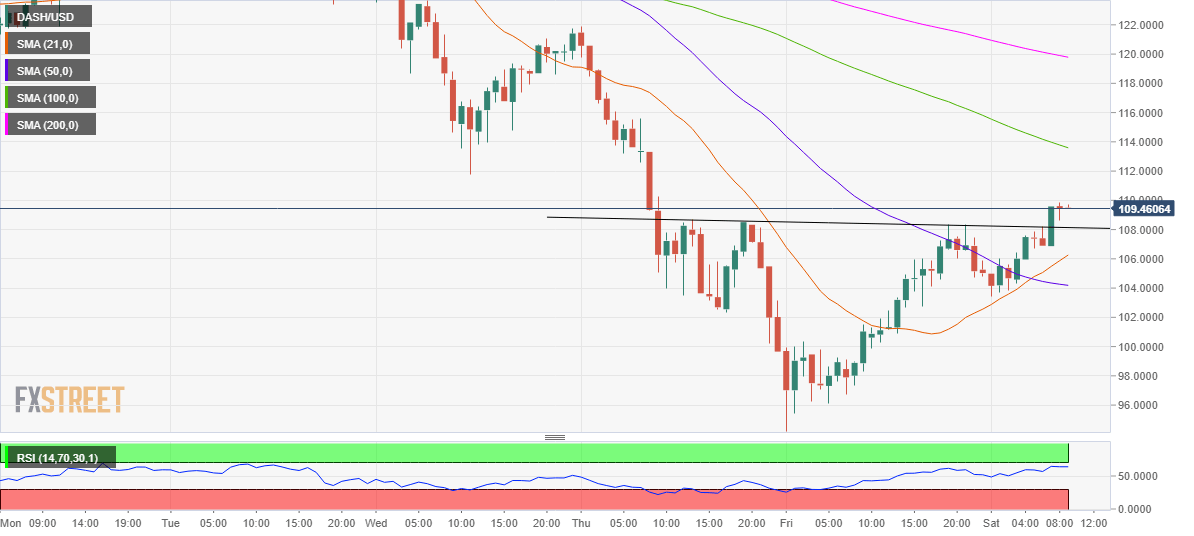
DASH/USD: Hourly chart

From a near-term technical perspective, the altcoin broke through the trendline resistance at $108.15, validating an inverse head-and-shoulders breakout on the hourly chart.

The bullish crossover, with the 21-hourly moving average (HMA) having cut above the 50-HMA, has also strengthened the case for further upside.

Therefore, the DASH bulls now aim for the pattern target measured at $122. Ahead of that the bearish 100-HMA at $113.77 could test the bulls’ commitment.

A sustained move above the latter, the critical downward-sloping 200-HMA at $120 would be tested. The Relative Strength Index (RSI) holds at higher levels, now at 63.84, pointing to more gains in the offing.

On the flip side, the inverse head-and-shoulders neckline resistance now support at $108.15 could offer an initial cushion.

 The bullish 21-HMA at $105.87 is likely to offer strong support, protecting the bulls against any downside pressures.

The sellers could also aim for the 50-HMA cap at $104.19 if the abovementioned support gives way.

All in all, the path of least resistance appears to the upside in the near-term.

DASH/USD: Additional levels

DASH/USD

Overview
Today last price109.4508
Today Daily Change4.4227
Today Daily Change %4.21
Today daily open105.0281
 
Trends
Daily SMA20114.3868
Daily SMA50106.0306
Daily SMA10092.8701
Daily SMA20085.352
 
Levels
Previous Daily High108.3565
Previous Daily Low94.2275
Previous Weekly High134.8442
Previous Weekly Low94.2275
Previous Monthly High119.222
Previous Monthly Low86.949
Daily Fibonacci 38.2%102.9592
Daily Fibonacci 61.8%99.6248
Daily Pivot Point S196.7182
Daily Pivot Point S288.4084
Daily Pivot Point S382.5892
Daily Pivot Point R1110.8473
Daily Pivot Point R2116.6664
Daily Pivot Point R3124.9763

Author

Dhwani Mehta

Dhwani Mehta

FXStreet

Residing in Mumbai (India), Dhwani is a Senior Analyst and Manager of the Asian session at FXStreet. She has over 10 years of experience in analyzing and covering the global financial markets, with specialization in Forex and commodities markets.

More from Dhwani Mehta
Share:

Editor's Picks

Crypto Today: Bitcoin, Ethereum, XRP recovery slows amid incessant capital outflows

The cryptocurrency remains in a broader corrective bias on Friday, despite majors such as Bitcoin (BTC), Ethereum (ETH), and Ripple (XRP) holding slightly higher than early-week support levels.

Cardano: Whale selling, cautious derivatives limit ADA rebound

Cardano is trading near $0.170 at the time of writing on Friday after staging a modest rebound from last week's sharp correction. However, the recovery remains fragile as large holders have resumed reducing their positions, adding fresh selling pressure to ADA.

Experts agree: Bitcoin nears bottom, but weak demand raises doubts

Bitcoin (BTC) is trading above $63,000 at the time of writing on Friday after rebounding from the key 200-week Simple Moving Average (SMA) near $62,000, a level widely viewed as key long-term support.

Pi Network Price Forecast: Bulls attempt comeback as bearish strength fades

Pi Network is trading at around $0.120 on Friday after a modest recovery the previous day. Despite this recent rebound, traders should be cautious as a scheduled unlock of 14.8 million PI tokens on Friday could limit the token's recovery potential by increasing market supply.

Experts agree: Bitcoin nears bottom, but weak demand raises doubts
Bitcoin (BTC) is trading above $63,000 at the time of writing on Friday after rebounding from the key 200-week Simple Moving Average (SMA) near $62,000, a level widely viewed as key long-term support. The recovery may suggest that Bitcoin has found a floor after a sharp correction that spanned more than a month, but some warning signs persist.