Dash Price Prediction: DASH ultimate liftoff to $80 in the offing
- Dash technical levels and indicators suggest a liftoff to $80 is in the offing.
- On-chain metrics show that recovery will not be easy as intense seller congestion zones await DASH/USD.

Dash has held onto support at $65 since the beginning of September. However, recovery has not been forthcoming, with the resistance at $80 remaining intact. Buyers attempted to regain control of the trend in mid-October, but they seem to have lost the steam marginally above $75.
Meanwhile, DASH/USD is doddering at $71 while holding onto the 50-day Simple Moving Average (SMA). The Relative Strength Index (RSI) highlights the possibility of a sideways price action taking precedence in the near term.
On the other hand, if the 50-day SMA immediate support holds, confidence will likely increase in the bullish camp. More buy orders would also come into play, creating an optimum volume for gains above $75 and towards $80.
DASH/USD daily chart
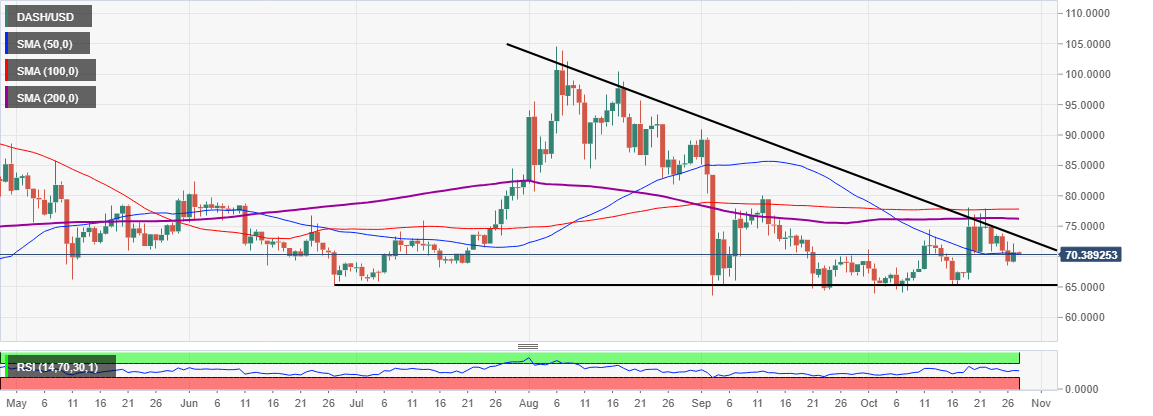
It is essential to keep in mind the hurdles that could delay the breakout to $80—starting with the seller congestion at $75, the 200-day SMA and 100 SMA. For now, immediate support is provided at $70, while extended declines would seek refuge at $65.
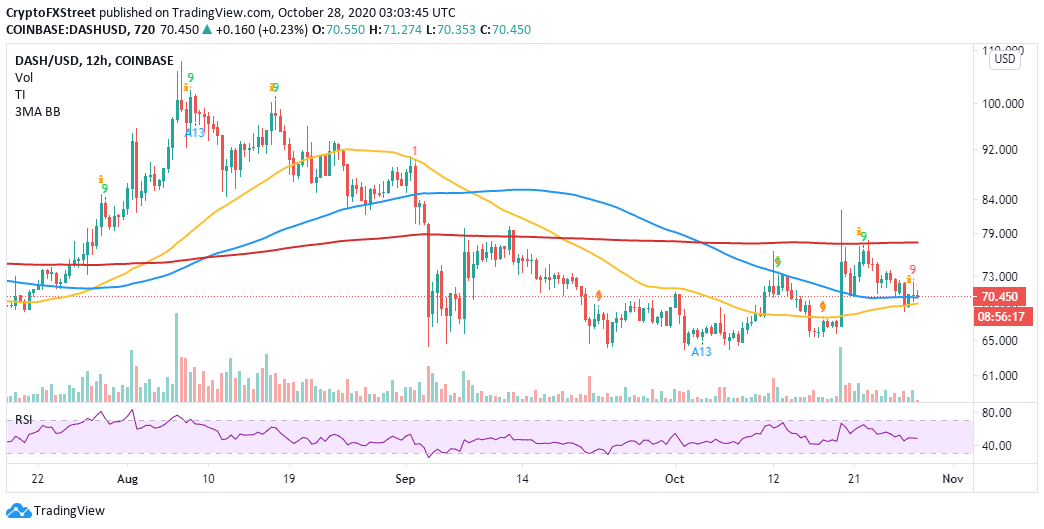
A buy signal presented by the TD Sequential Indicator on the 12-hour chart adds credence to the bullish scenario. Simultaneously, DASH/USD is resting on the immediate support provided by the 100 SMA. Marginally below this level, the 50 SMA is in line to stop declines likely to sabotage the recovery. On the upside, the next target is the 200 SMA, which could catapult Dash past $80.
DASH/USD 12-hour chart
Looking at the other side of the fence
It is worth mentioning that on-chain metrics are bearish on Dash despite technicals beings relatively positive. Particularly, IntoTheBlock’s IOMAP model pokes holes in the bullish narrative, shining a light on the intense resistance ahead of the crypto.
For instance, the most robust seller congestion lies between $73 and $74. Here, nearly 57,000 addresses previously bought around 520,000 DASH. According to the model, this hurdle and several others may hinder price action to $80.
On the downside, support is small compared to the gigantic resistance—the most significant running from $64 to $67. Here, approximately 46,000 addresses previously purchased roughly 312,000 DASH. In case this support is shattered, DASH/USD could embark on a spiral under $60.
Author

John Isige
FXStreet
John Isige is a seasoned cryptocurrency journalist and markets analyst committed to delivering high-quality, actionable insights tailored to traders, investors, and crypto enthusiasts. He enjoys deep dives into emerging Web3 tren




