Dash price analysis: Hits the barrier after breakout
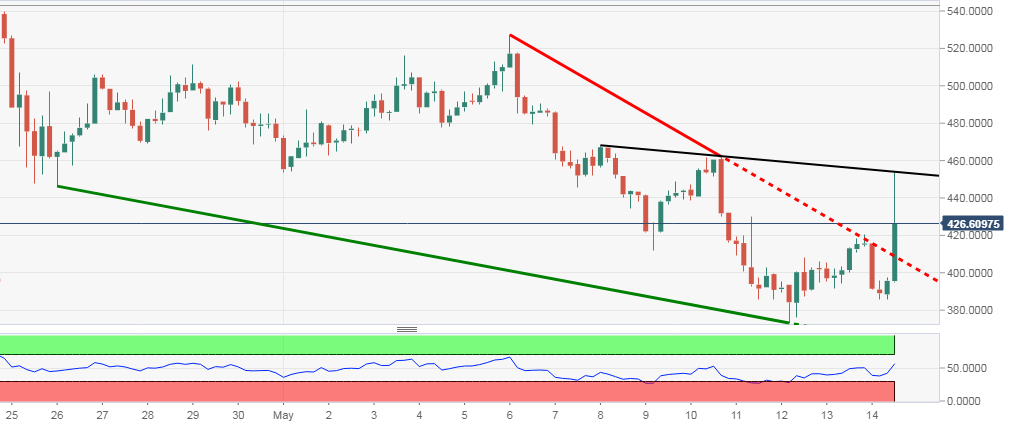
- Dash prices break out of a falling wedge, in the short term.
- Hit a horizontal resistance immediately.

Dash bulls rejoice after breaking out of a technical pattern on a short term chart but their joy was shortlived as it hits a barrier immediately after a breakout rally and unless this resistance is crossed, this small rally may also fizzle out.
DASH/USD is up more than 4 percent on day at $432.689 but has come off quite a bit after hitting a high of $453.84 immediately after breaking out of the falling wedge pattern on the 240-minute chart and there comes a horizontal resistance line in the form of earlier lower lows.
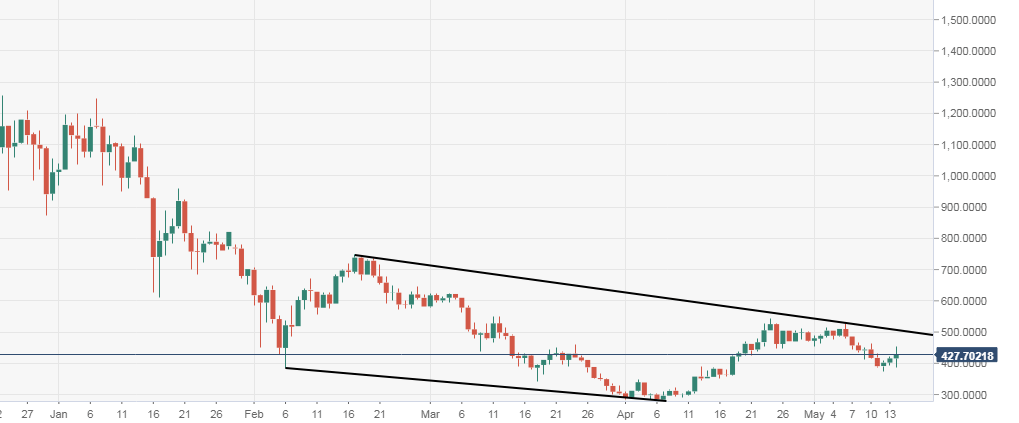
On the daily chart too, the price pattern suggests it is stuck in a downward sloping lower low, lower high pattern and thus faces multiples resistances in the short term as well long term charts.
DASH/USD 240-minute chart:
DASH/USD daily chart:
Author

Manoj B Rawal
Independent Analyst
Manoj B Rawal, financial markets professional with about 11 years of experience in writing, editing and advising on stocks, currencies and fixed income.


