Dash Price Analysis: DASH/USD jumps above the $60-level for the first time since November 2019
- DASH/USD went up from $50.55 to $56.85 this Friday.
- The Elliott Oscillator shows 15 straight green sessions of increasing intensity.

DASH/USD daily chart
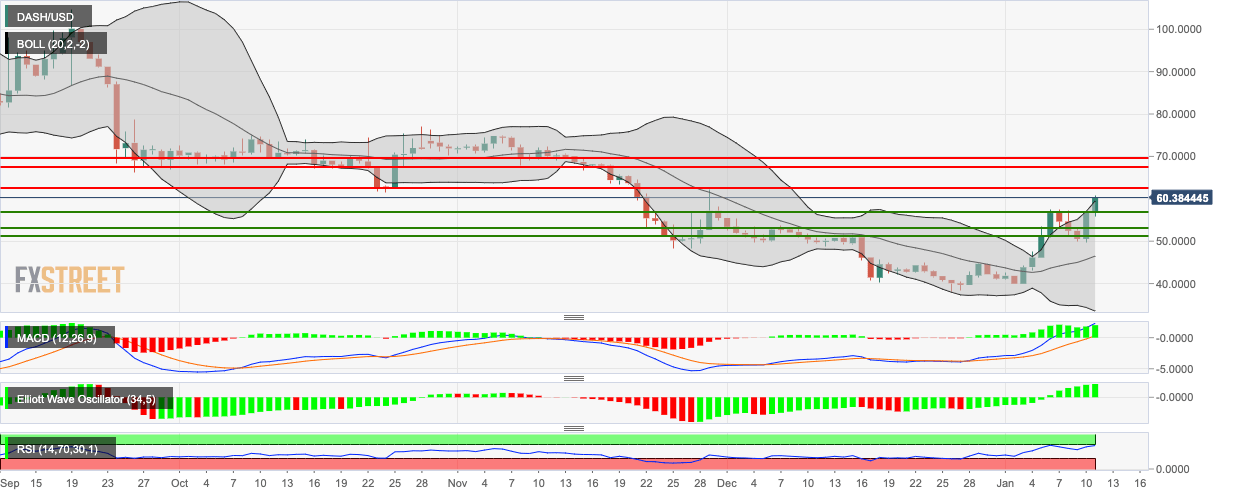
DASH/USD is on course of charting a second straight bullish day. DASH/USD jumped from $50.55 to $56.85 this Friday and has gone up further to $60.45 this Saturday. In the process, DASH/USD went above $60 for the first time since November 2019. The bulls pushed the price above the 20-day Bollinger Band, indicating that the asset is overpriced and will face bearish correction. The Elliott Oscillator has had 15 straight green sessions of increasing intensity, while the Moving Average Convergence/Divergence (MACD) indicates increasing bullish momentum. The Relative Strength Index (RSI) indicator is hovering around 67.80, next to the overbought zone, hinting that the price may go up some more before facing bearish correction.
Author

Rajarshi Mitra
Independent Analyst
Rajarshi entered the blockchain space in 2016. He is a blockchain researcher who has worked for Blockgeeks and has done research work for several ICOs. He gets regularly invited to give talks on the blockchain technology and cryptocurrencies.


