Daily Technical Analysis of ZAP, ChainLink and ETH: Reviewing trade setups and comparison of price movement

When mentions of decentralized oracle platforms are being made, key players such as ZAP, ChainLink, and Ethereum come to mind. The three projects focus on providing blockchain decentralization for DApp developers and investors. Zap (ZAP) is the first-ever decentralized oracle platform to be released to the public, however, its official launch wasn't until January 2019.
Ethereum was first described in a 2013 whitepaper by Vitalik Buterin while officially launched on July 30, 2015. Three months after its launch, Ethereum traded at an all-time low of $0.4209. 5 years down the line, Ethereum is up 436,015% from its lowest lows.
Chainlink, ZAP's closer alternative which aims to connect smart contracts with data from the real world, came onto the scene after an ICO round in 2017. The decentralized oracle network reached an all-time low of $0.1263 on Sep 23, 2017. Almost three years later, at a present price of $30.90, Chainlink is up 24,719% from its lowest lows.
Given that the cryptocurrency space is currently evolving and expanding, Zap Protocol diversifies its use case, presenting a multifunctional blockchain solution that offers full liquidity around many DeFi use-cases such as data monetization, token creation, and creating various decentralized applications (DApps).
ZAP Technical Analysis: Charting the ZAP/USD Odds-On Advance Towards $0.35 Level
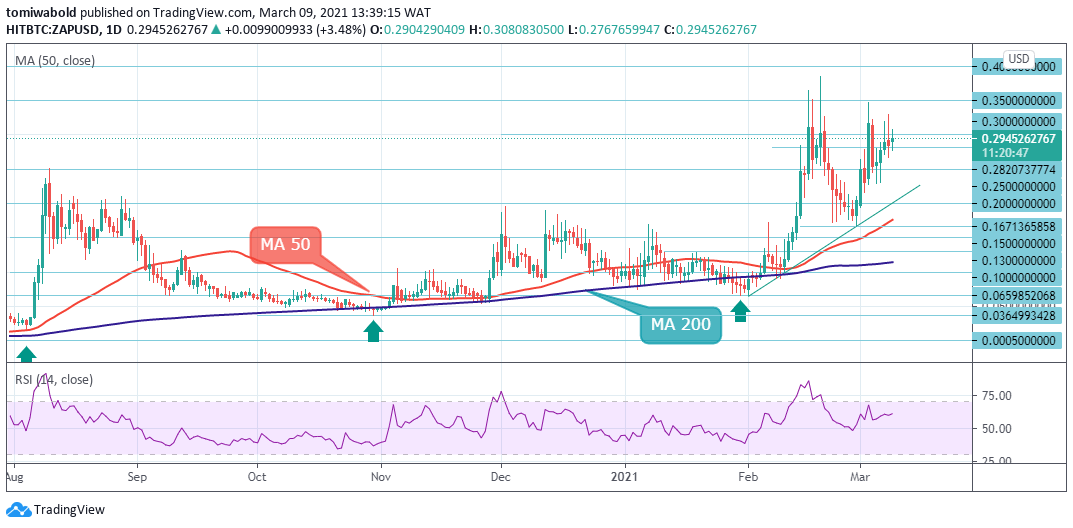
ZAP/USD Daily Chart
As ZAP enters its bull cycle, the price of ZAP/USD has been volatile, topping out at $0.3853, and now trading near $0.2945 after hitting intraday highs at $0.3080 today. On the daily chart, the strong bull trend continues to exist with a positive linear price trend, including a prop up between the MA 50 at $0.10, ascending trendline bounce at $0.1671, and price of $0.25 as a key lift-off zone.
Also, further bullish confirmation can be found via the relative strength index (RSI), which has consistently remained beyond its midline since Feb. 5, despite a few brief attempts to break beneath the 50 reading. These indicators may indicate validation of upside continuation of the price for ZAP back towards $0.30 to $0.35 and beyond is likely; before succumbing to the overall bearish trend once again. Key support to note remains at $0.20.
Supply Levels: $0.4000, $0.3500, $0.3000
Demand Levels: $0.2500, $0.2000, $0.1500
ChainLink Technical Analysis: Bullish Impulse Steady on LINK/USD Beyond $30 Breakout
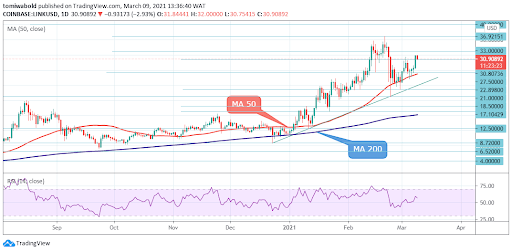
LINK/USD Daily Chart
LINK is currently sitting above the $30 region and attempting a breakout higher. The daily relative strength index (RSI) recently dipped downward and currently hovering above its midline. If price can enter the upside channel with momentum, it has an increased probability of completing a breakout to $40 given RSI is not near the overbought territory of 75.
On the flip side, if short positions increase rapidly under the MA 50 with significant price movement downwards, it will result in an exaggerated move as these positions will begin to unwind. Although the RSI does not currently hold a bearish view. The support levels for the price are $27.50, $22.89, and $21.00, while price targets for a successful breakout (breaking above $30.00) are $33.00, $36.92, and $40.00.
Supply Levels: $40.00, $36.92, $33.00
Demand Levels: $27.50, $22.89, $18.50
Ethereum Technical Analysis: ETH/USD Upswing Stays Relentlessly Towards $2,000 Amid Gains
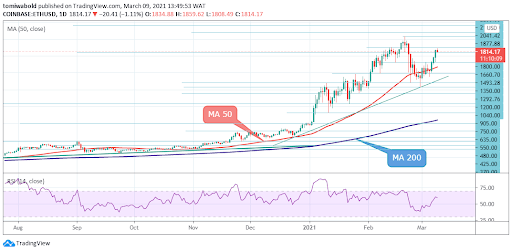
ETH/USD Daily Chart
Technicals for the ETH/USD remain strongly in favor of a definitive bullish trend. The upside target sits at the psychological resistance of $2,000 as the asset is currently in price detection trend. On the daily chart for the ETH/USD pair, the price bounced bullishly on the ascending trendline support at $1,292.76 level of Feb 28th, and a 50% bull rally has followed.
The spot price is fixated on the $2,000 psychological resistance. ETH historical support (horizontal lines) shows support at $1,200 with no resistance above the current price level. As long as bulls keep the ETH/USD pair above $1,660 and the MA 50, then a rally towards the $2,040 yearly high could take place.
Supply Levels: $2,200, $2,100, $2,000
Demand Levels: $1,660, $1,493, $1,292
In Summary
ZAP traded at its lowest lows of $0.001334 on Nov 15, 2019, and at a present price of $0.2945, ZAP is up by 21,960% from its all-time lows. In comparison with Chainlink, ZAP has stronger growth potential, considering the time it took ZAP to record almost 90% of Chainlink's growth. Furthermore, the three projects have traded below a dollar at the inception stage but made numerous price advances due to their positive use case over time.
So, given ZAP’s increasingly strong use case and the gains Chainlink has recorded, it’s easy to see why many investors are bullish on ZAP and expect it to emerge as a formidable rival to Chainlink in the not-too-distant future.
While it remains difficult to estimate exactly when ZAP’s price will breach the dollar mark and approach a similar price point to Chainlink, all the fundamentals and indicators certainly suggest a positive outlook for this specific decentralized oracle platform.
Author

Tomiwabold Olajide
FX Instructor
Tomiwabold is a forex trader and cryptocurrency analyst. A technical analyst, as well as an experienced fund manager, he has also co-authored several books on Forex trading.


