Cryptocurrencies Price Prediction: Polygon, Zilliqa & Ethereum – European Wrap 25 April

MATIC price primed for an upswing as Polygon-based NFT activity soars above $1 million
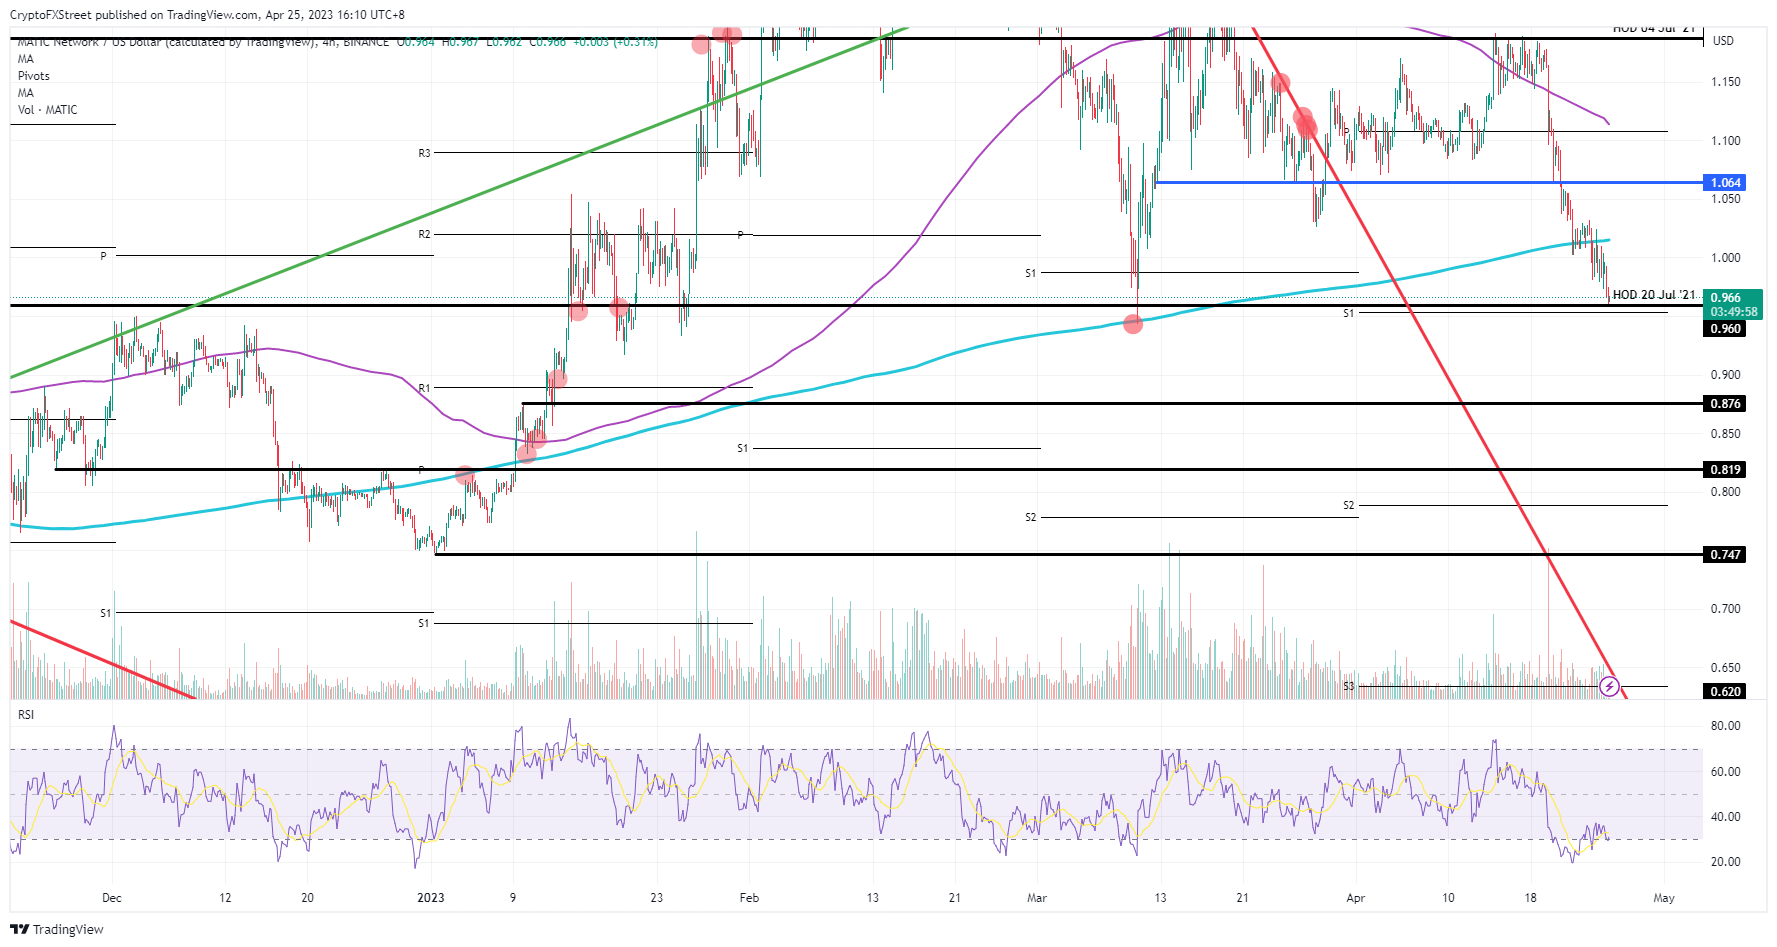
Polygon (MATIC) price has been seen tanking sharply on Monday and Tuesday as price action slips further away from the 200-day Simple Moving Average (SMA). Although the sentiment looks bearish, one big element provides a bullish undertone. Expect to see a turnaround soon as NFT sales in MATIC are outpacing ETH sales substantially these past few days.
Polygon price has broken the support from the 200-day SMA as bears are pushing MATIC against $0.96 with a pivotal level and the monthly S1 support level nearby. Although the sentiment looks very bearish, there is one big bullish element that should not be ignored. According to Sealaunch.xyz, NFT sales have recently surged in favor of Polygon and are now outpacing ETH-based sales.
ZIL holders watch EVM implementation on Zilliqa closely, here’s what to expect
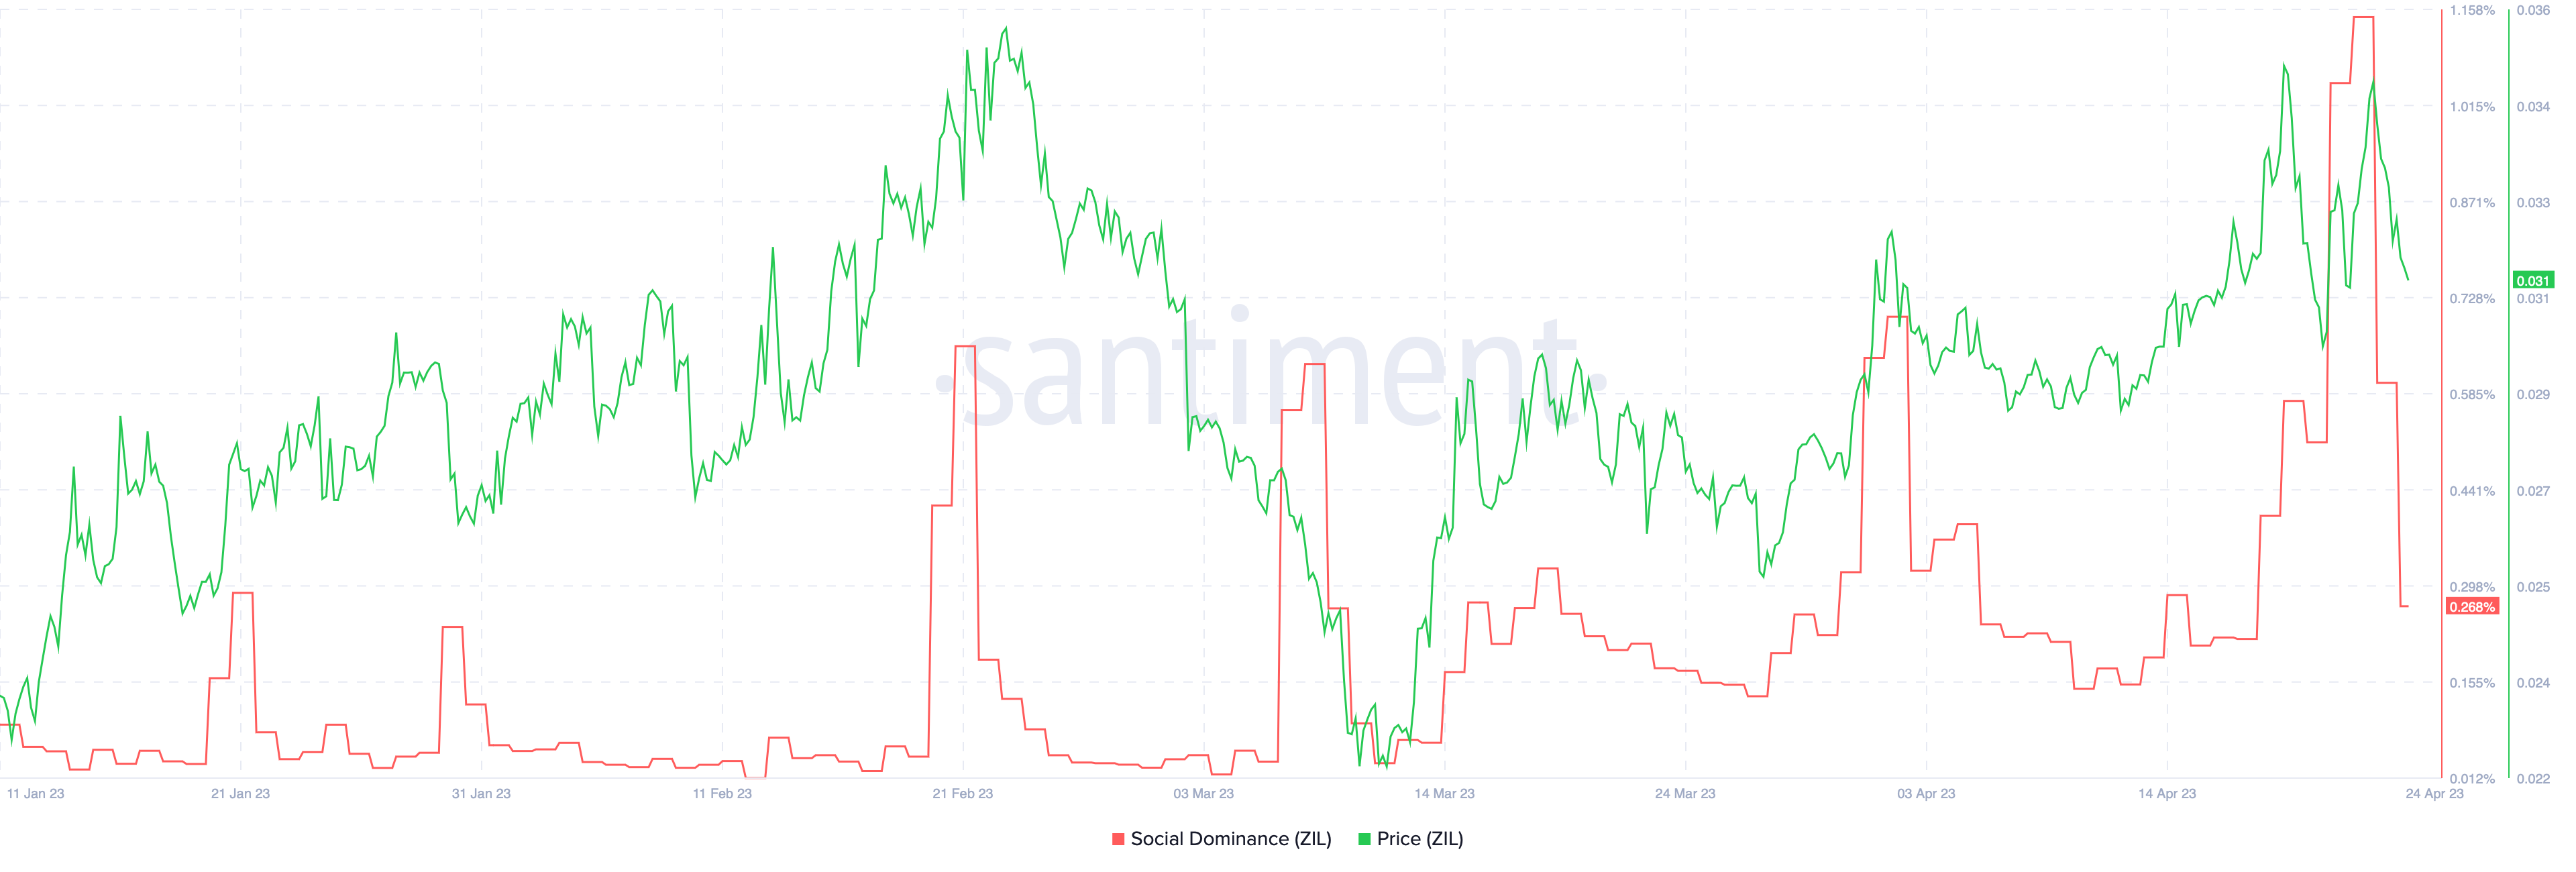
Zilliqa, a high-throughput blockchain is set to activate its Ethereum Virtual Machine (EVM) compatibility on Tuesday. Through this update, the project will enable several key features like faster transaction processing, native transfer of tokens without conversion and higher decentralization.
ZIL price yielded nearly 5% losses for holders overnight, it remains to be seen whether the EVM upgrade acts as a catalyst for the token’s recovery. Zilliqa development team has announced the arrival of Zilliqa 2.0 with the upcoming EVM upgrade on Tuesday. The upgrade will activate the blockchain’s compatibility with EVM and this will allow traders to transfer tokens without converting them, cutting out complex processes.
Ethereum price presents traders opportunity to long ETH to $2,000
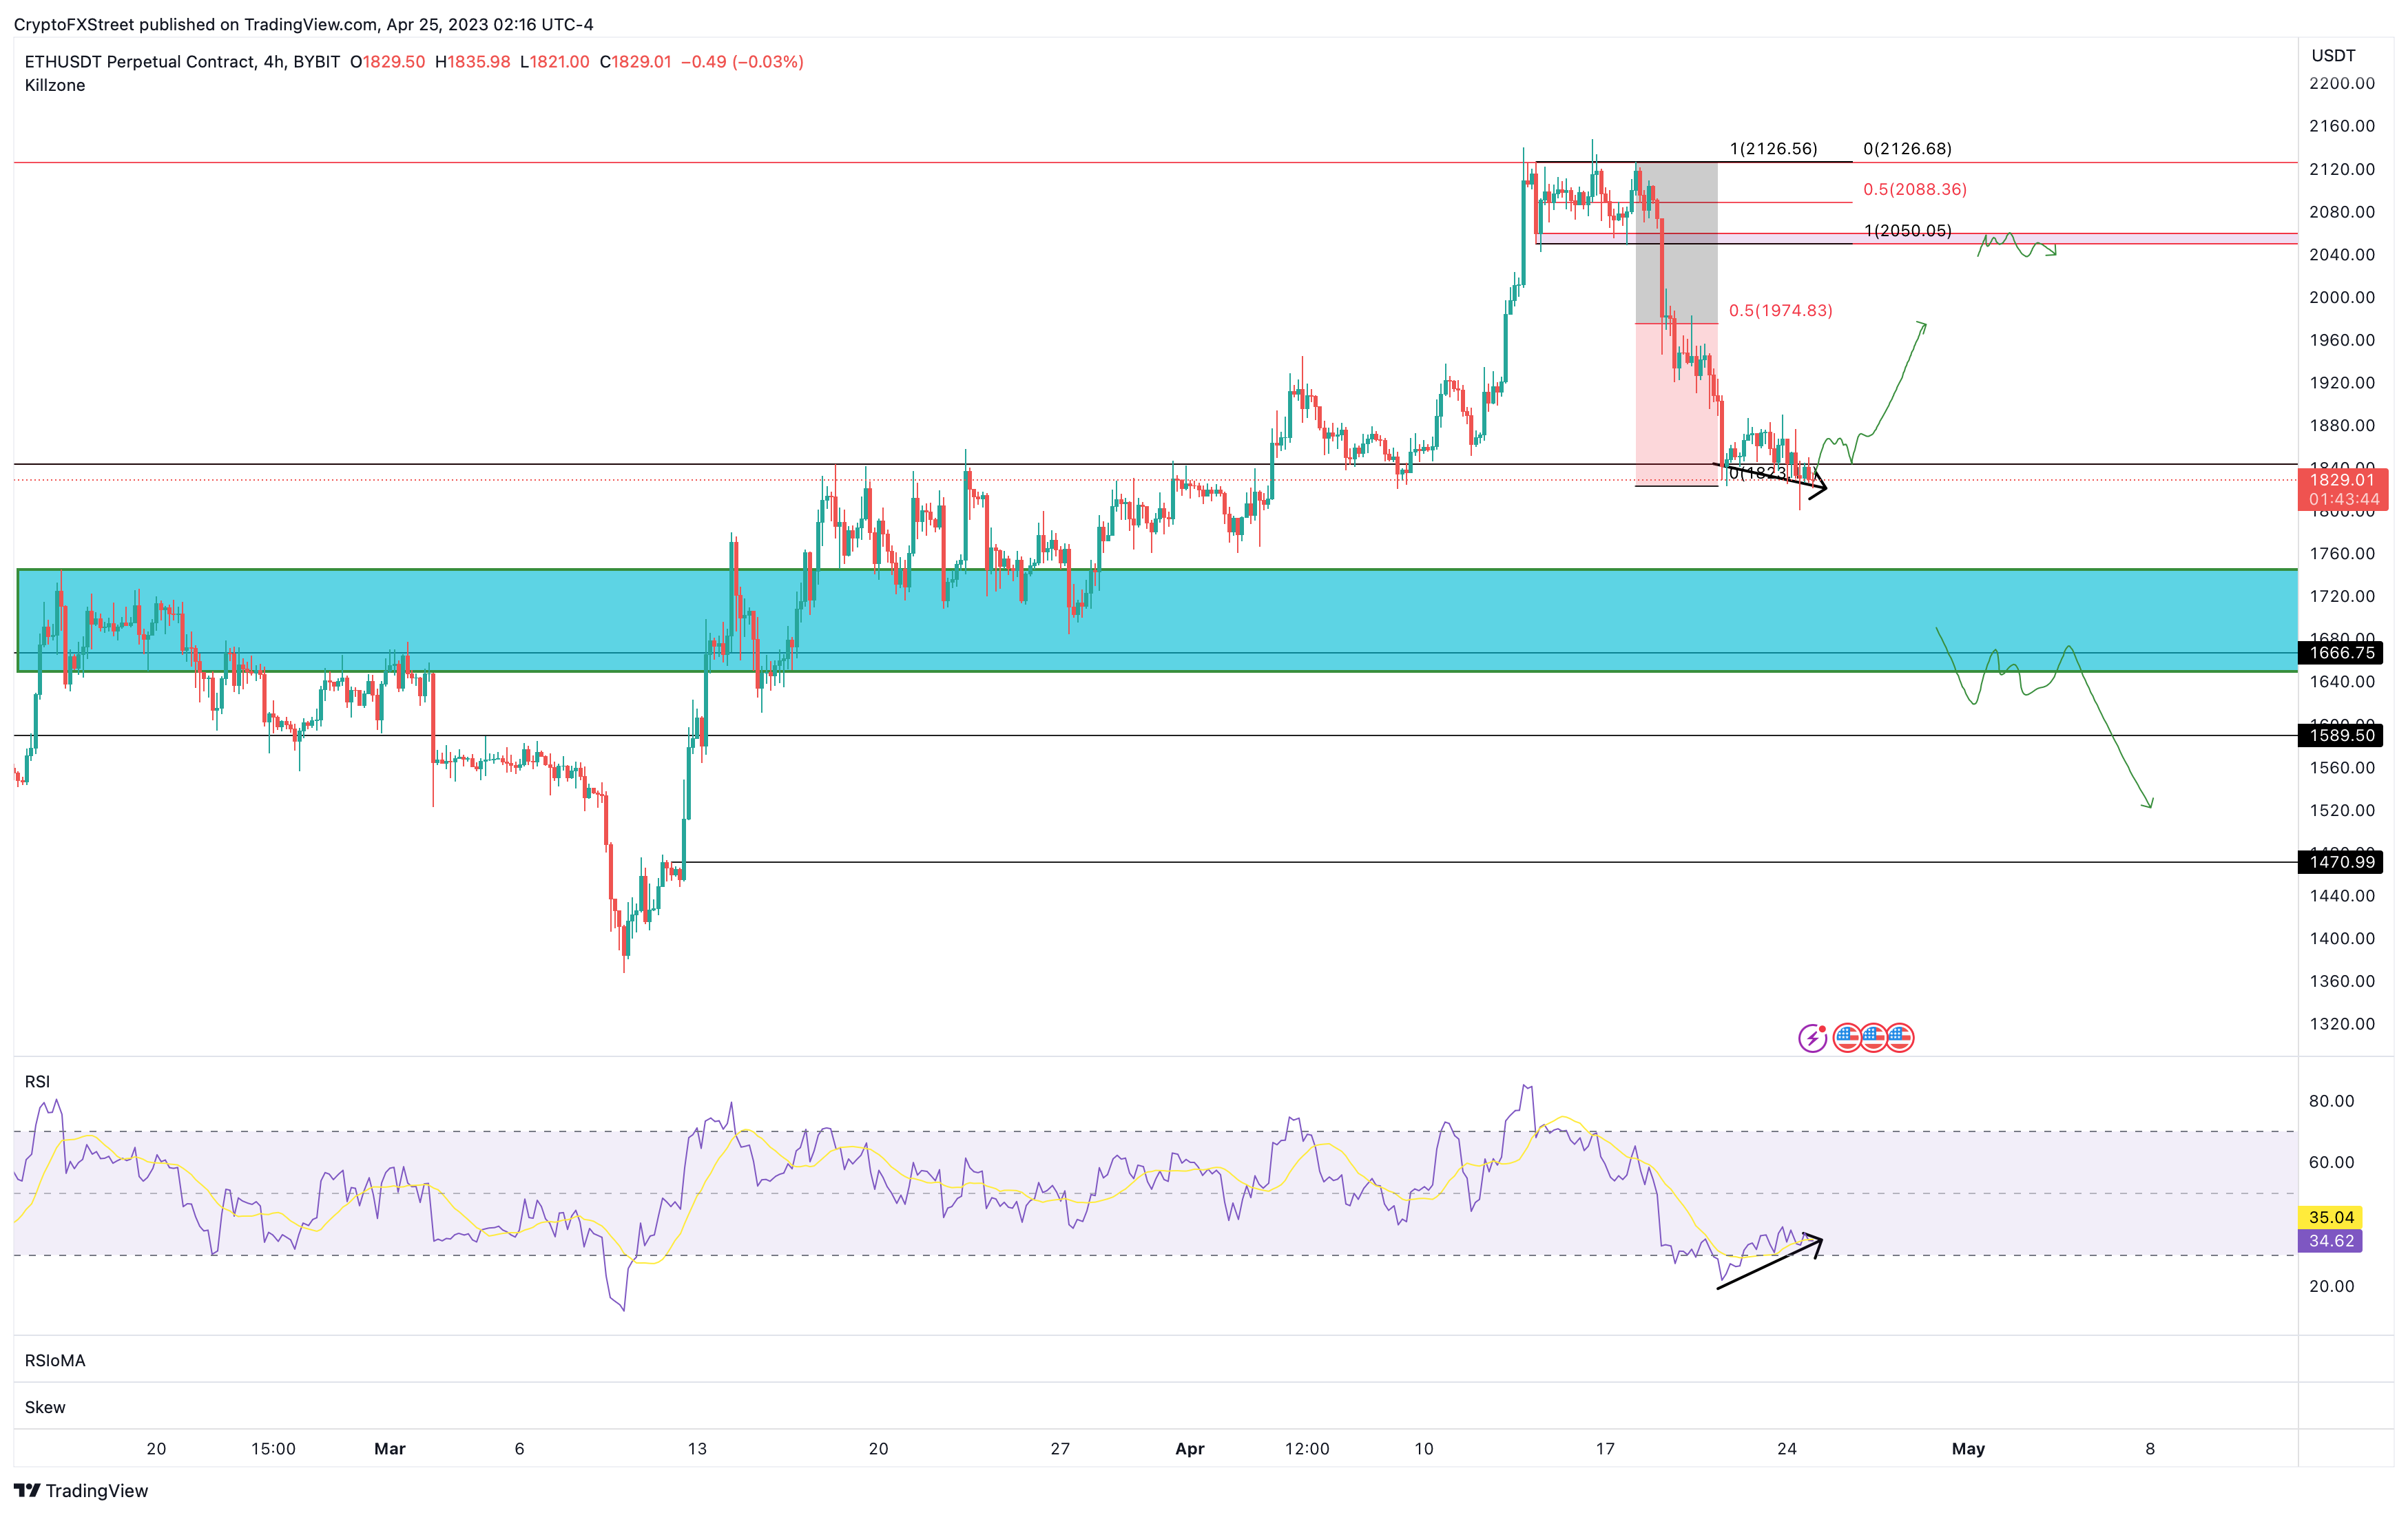
Ethereum price shows a bullish sign which coincides with a similar buy signal seen on Bitcoin price on the four-hour chart. This development could prove to be extremely profitable for investors if they act on ETH.
Ethereum price has been consolidating tightly around the $1,843 support level after a recent 14% crash. This range-bound movement has produced lower lows, while the Relative Strength Index has produced higher lows, signaling a non-conformity termed as ‘bullish divergence.’
Author
FXStreet Team
FXStreet
Composed of a group of economic journalists and FX experts, the FXStreet content team produces and oversees all content published on FXStreet. It provides a purely journalistic approach to the Forex market.


