Bitcoin Weekly Forecast: BTC recovery rally could be bull trap in disguise, here’s why
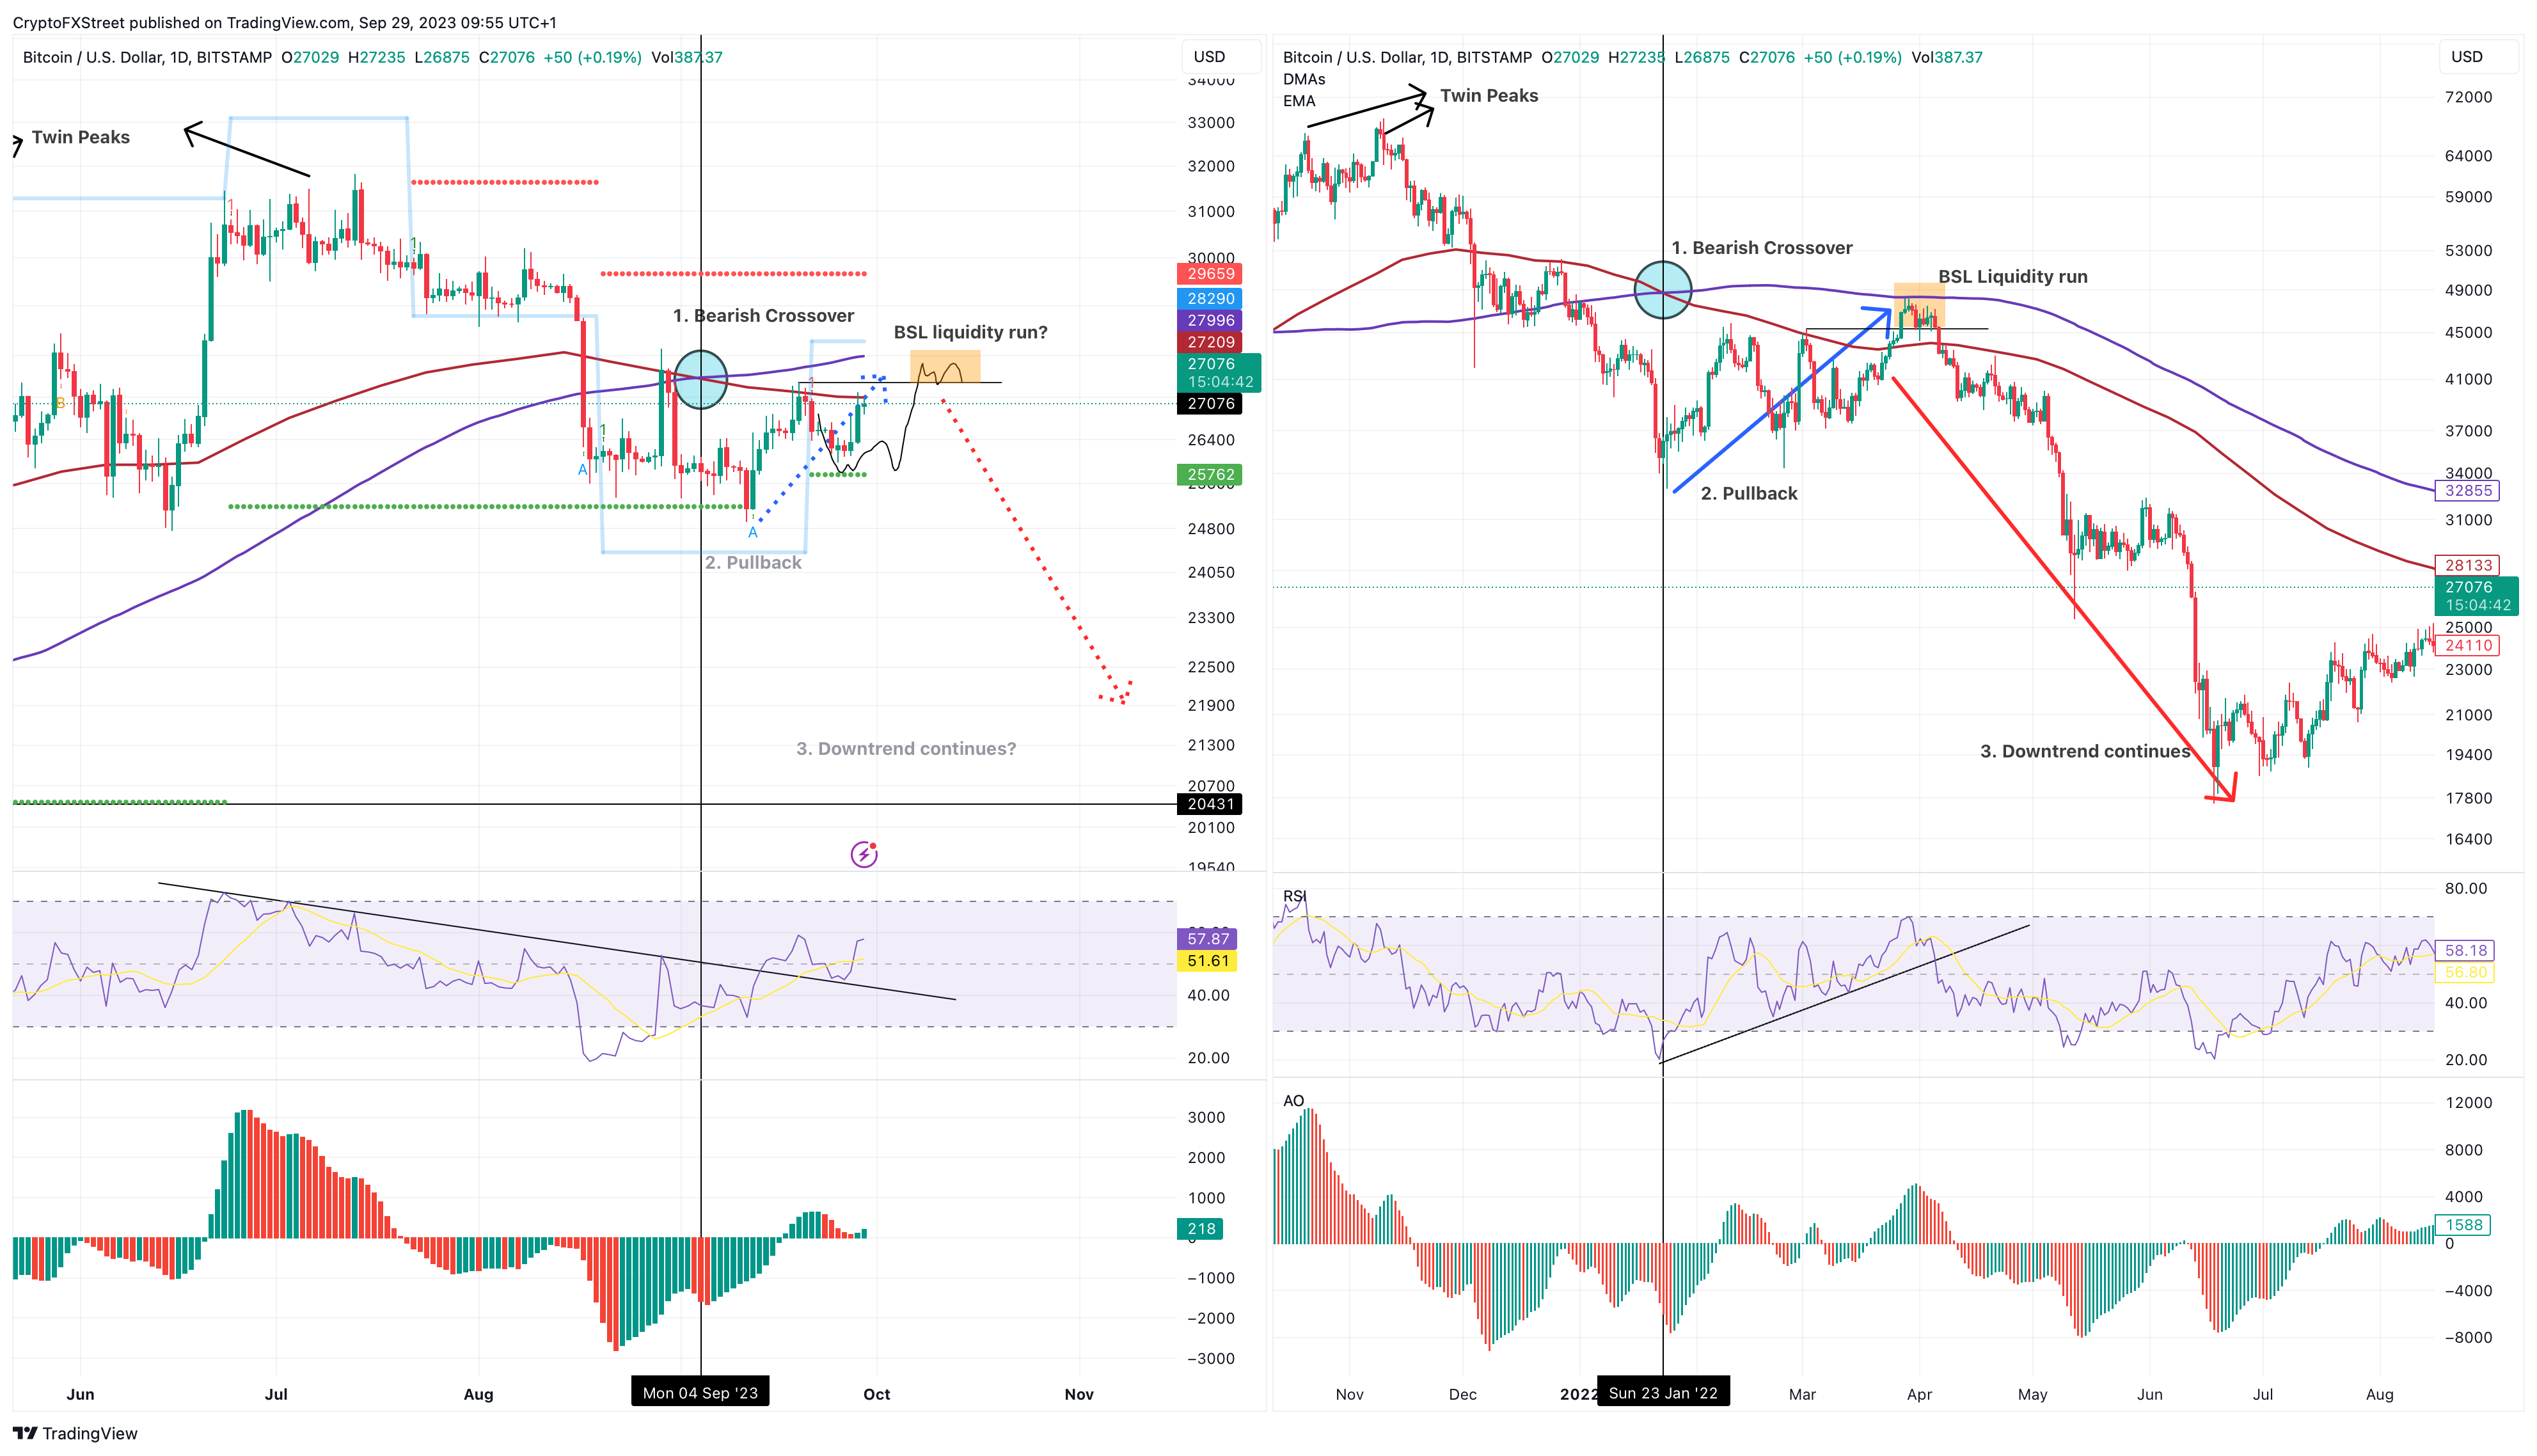
Bitcoin (BTC) price remains unfazed even after the multiple spot BTC ETF delays from the US Securities & Exchange Commission (SEC). But investors need to be careful with the ongoing BTC rally as it could be a trap for early bulls.
Bitcoin (BTC) price is currently close to retesting the 20-week Exponential Moving Average (EMA) as shown in the chart below. The previous article sheds light on a potential fractal that could trigger a massive correction, should history repeat.
Polkadot Price Forecast: DOT reversal seems inevitable after 92% correction from all-time high
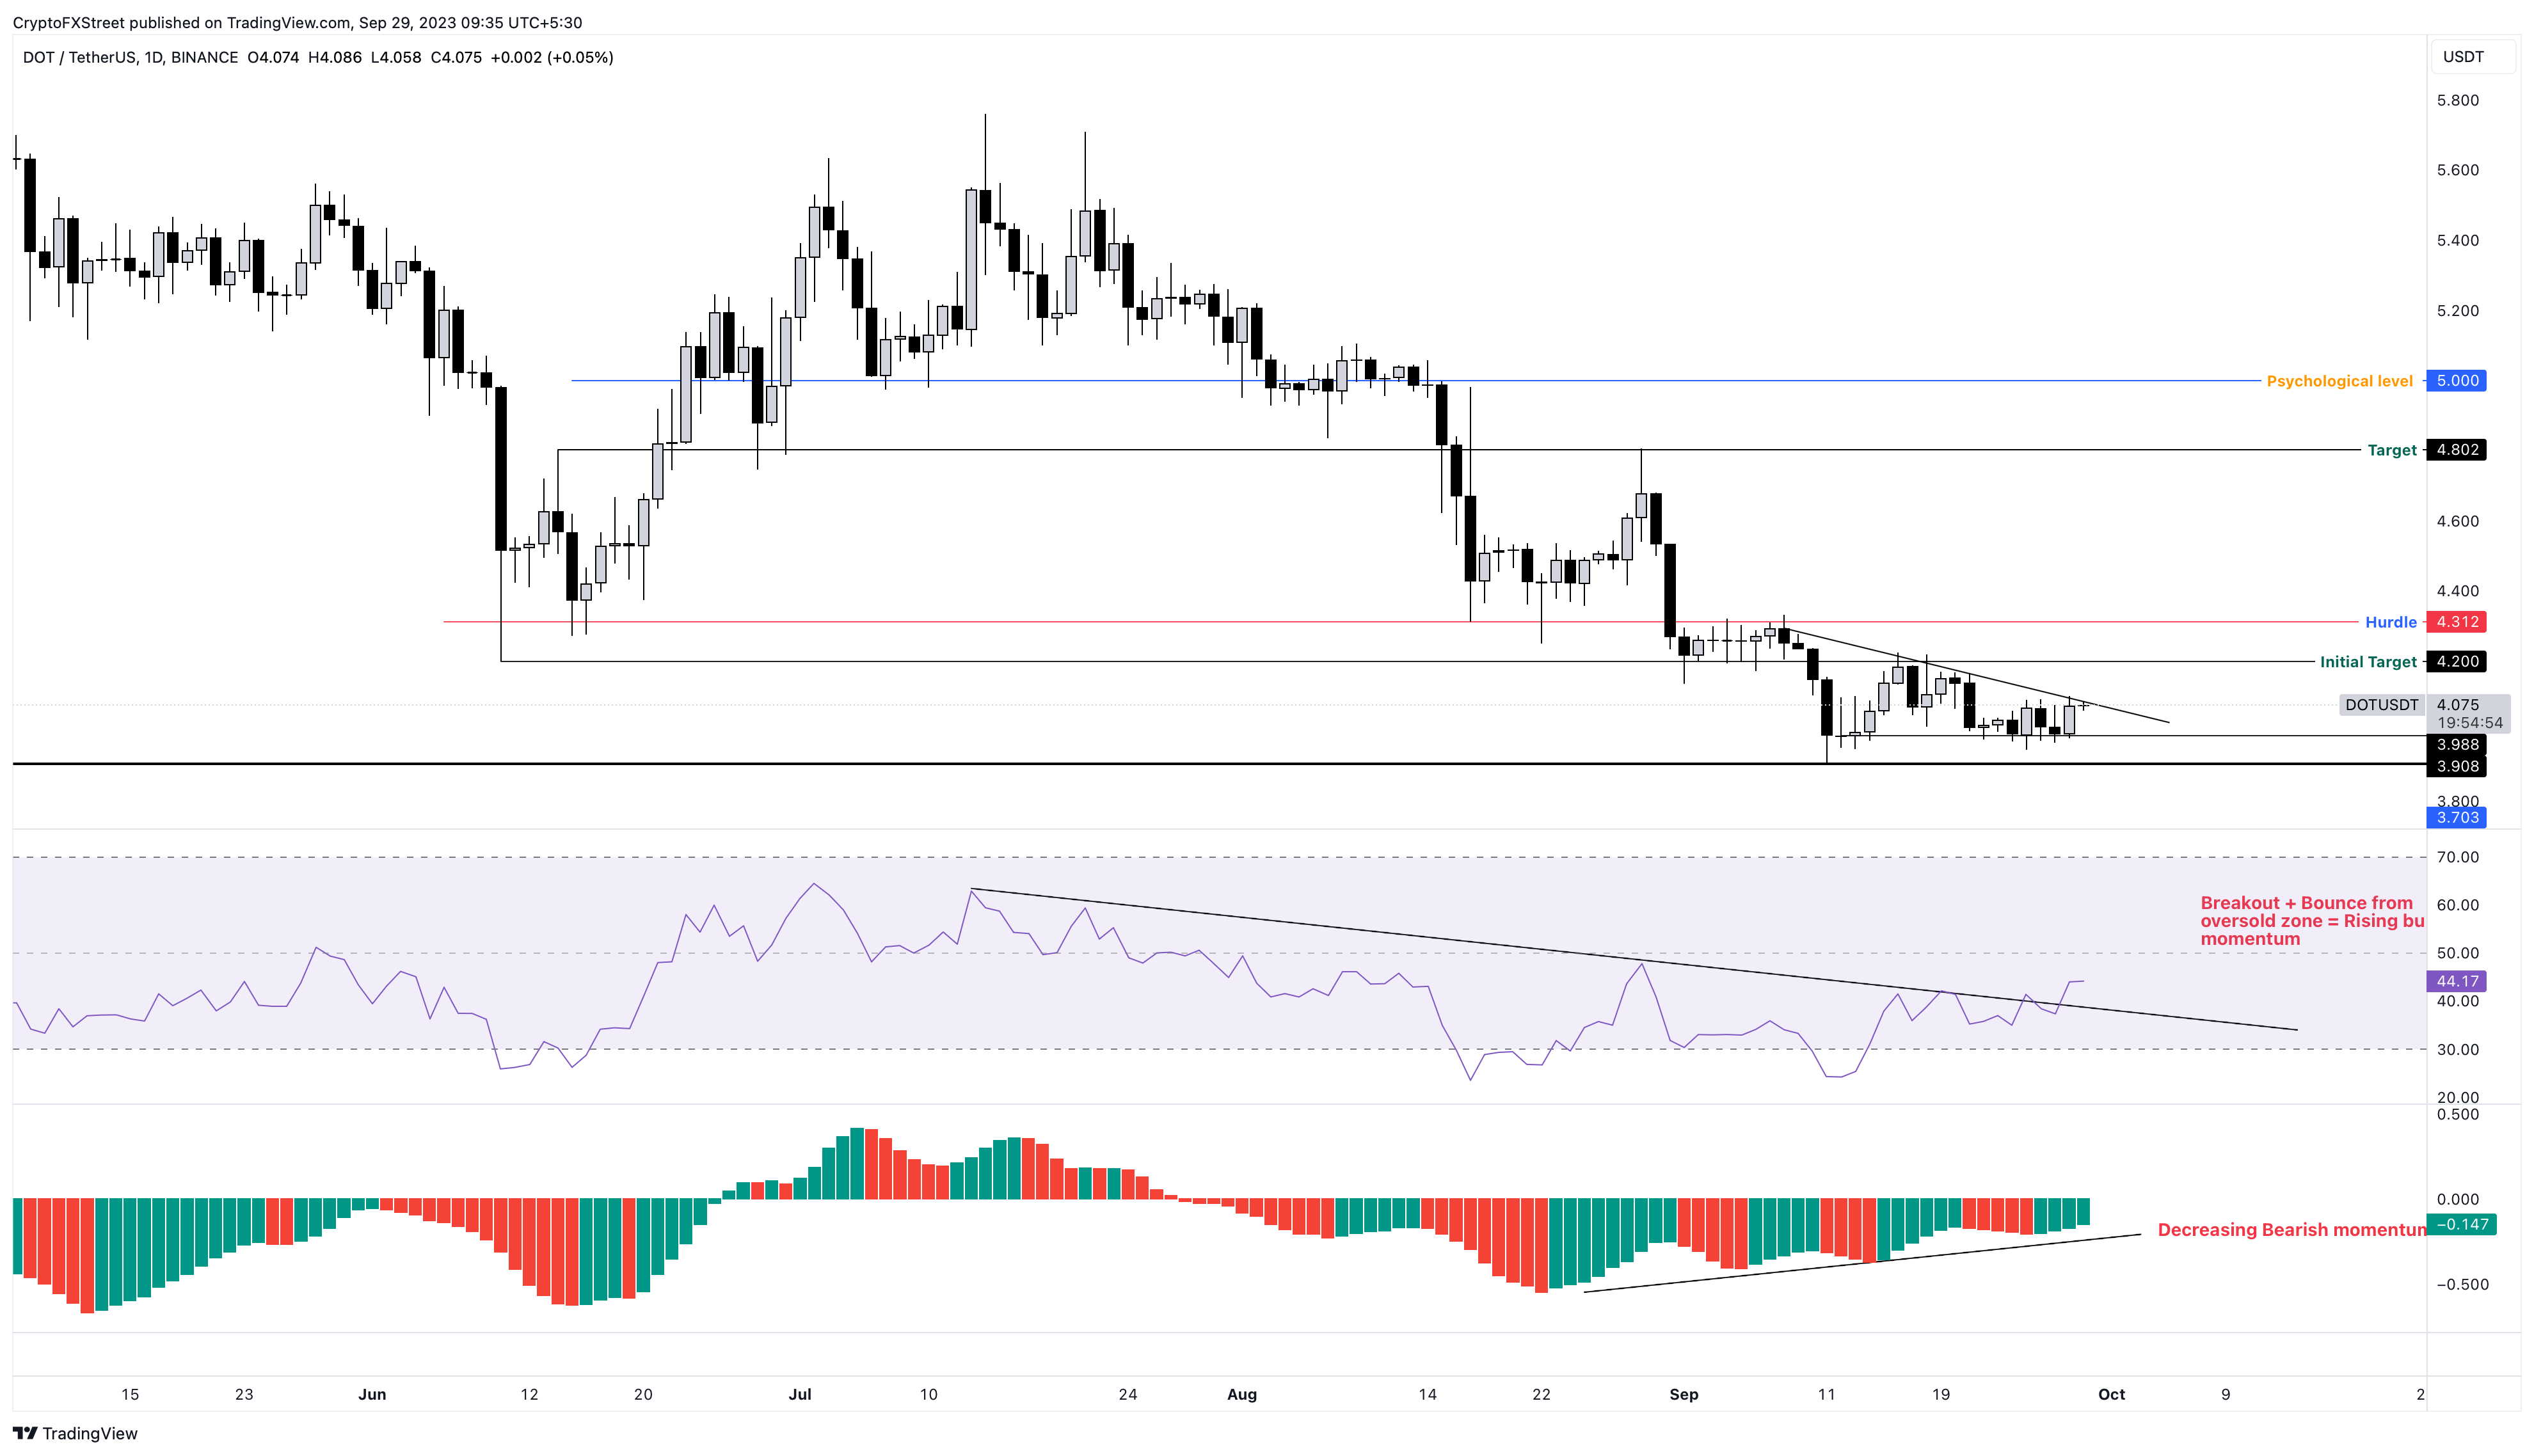
Polkadot (DOT) price, in nearly two years, has shed 92.91% from its all-time high of $55.09. The massive downswing in DOT has pushed it down to levels that were last seen in October 2020. Hence, the chances of this altcoin forming a bottom and rallying are high.
Polkadot price is down 92.91% from its all-time high and currently trades in a tight range. The three lower highs and equal lows on the daily chart have created a descending triangle setup. Descending triangles, when formed after a rally or at the top of a trend, could result in a downtrend upon breakout. But since DOT is down 92.91% from its all-time high, the chances of a downward breakout are less.
Key signals of crypto market revival
The crypto market has been torn, rising over 2% in the last 24 hours to $1.076 trillion. The excitement came after the approval of the Ethereum Futures ETF from Valkyrie, which will be available for trading from Friday. It's not the victory everyone expected, as they were waiting for a long list of spot Bitcoin ETFs to be approved. But the positive news coincided nicely with a rebound in equity markets and a corrective decline in the dollar, adding fuel to the fire.
Bitcoin surged above $27K on Thursday, gaining over $800 (3.2%). The momentum allowed it to climb above its 50-day moving average, something it has been unable to do since early August. The ability to hold levels above this curve will be the first confirmation of a change in trend and will turn observers' attention to the 27.5 area, where the previous local highs are located. We believe a move above $28K will attract even more buying interest.
Information on these pages contains forward-looking statements that involve risks and uncertainties. Markets and instruments profiled on this page are for informational purposes only and should not in any way come across as a recommendation to buy or sell in these assets. You should do your own thorough research before making any investment decisions. FXStreet does not in any way guarantee that this information is free from mistakes, errors, or material misstatements. It also does not guarantee that this information is of a timely nature. Investing in Open Markets involves a great deal of risk, including the loss of all or a portion of your investment, as well as emotional distress. All risks, losses and costs associated with investing, including total loss of principal, are your responsibility. The views and opinions expressed in this article are those of the authors and do not necessarily reflect the official policy or position of FXStreet nor its advertisers. The author will not be held responsible for information that is found at the end of links posted on this page.
If not otherwise explicitly mentioned in the body of the article, at the time of writing, the author has no position in any stock mentioned in this article and no business relationship with any company mentioned. The author has not received compensation for writing this article, other than from FXStreet.
FXStreet and the author do not provide personalized recommendations. The author makes no representations as to the accuracy, completeness, or suitability of this information. FXStreet and the author will not be liable for any errors, omissions or any losses, injuries or damages arising from this information and its display or use. Errors and omissions excepted.
The author and FXStreet are not registered investment advisors and nothing in this article is intended to be investment advice.
Recommended Content
Editors’ Picks
Dogecoin price bullish outlook intensifies as DOGE turns 10

Dogecoin price has sustained the bullish outlook since October 18, when the broader market turned green, leading meme coins in an uptrend, which is no mean feat. The 65% climb has ushered the dog-themed cryptocurrency to its tenth birthday since its official launch on December 6, 2013.
Bitcoin-based meme coin ORDI price action wobbles after 1,100% rally

The Bitcoin-based BRC-20 meme coin, which had people confused as being an actual valuable token, is now slowly creeping up to that status. ORDI price rise over the past couple of days has been astonishing, and with BTC driving the price and crossing $44,000, ORDI is also gaining rapidly. But not for long.
Arbitrum price veers as hard fork proposal receives 99.84% votes in favor

Arbitrum's price surpassed expectations as the altcoin managed to restrict the fluctuation over the past 24 hours. This is because ARB was forecasted to rally following the result of the proposal to essentially hard-fork the chain.
Bitcoin price hits $44,000 as Coinbase CEO speculates BTC could be key to extending Western civilization

Bitcoin (BTC) price has revisited levels last seen in April 2022, prior to the collapse of the Terra UST ecosystem. Its foray above the $42,000 psychological level has market watchers enthused.
Analyzing potential $30k corrections ahead of BTC ETF approval

Bitcoin has slowed down its 2023 bull rally as it approaches the $37,000 level. After three weeks of consolidating around this level, BTC shows no directional bias whatsoever. Some investors speculate this could be an upward-sloping accumulation that leads to a $40,000 rally.