Crypto.com token remains constricted, indecision may push CRO to retest $0.40
- Crypto.com price closed in 2021 with an 860% gain.
- The massive rise from late October 2021 through December 2021 has been maintained.
- CRO may test lower before resuming any uptrend.

Crypto.com price action had been one of the biggest surprises of 2021. Substantially bullish technical and fundamental events propelled CRO into a major leader in the cryptocurrency space. Traders now await a clear direction for price action as Crypto.com price consolidates.
Crypto.com price trades in a tight range; substantial Ichimoku resistance levels ahead
Crypto.com price continues to trade in a tight range between $0.50 and $0.61 – essentially the 38.2% and 50% Fibonacci retracement levels. This price action behavior has lasted for over thirty days and does not appear to be changing anytime soon. Therefore, the probabilities are weighed heavily to the downside in the short-term regarding a breakout direction.
The chart's blue and red horizontal rays represent the weekly Tenkan-Sen (Blue) at $0.77 and the weekly Kijun-Sen (Red) at $0.66. between the weekly Tenkan-Sen and Kijun-Sen, the daily Cloud (Senkou Span A and Senkou Span B) exist. Combining those four Ichimoku levels on two different time frames produces a massive resistance zone, limiting how much higher CRO price can go.
CRO price is below the daily Cloud, Tenkan-Sen, and Kijun-Sen. Only one condition remains before CRO price action would create a powerful Ichimoku short entry known as the Ideal Bearish Ichimoku Breakout. The final condition required is the Chikou Span to close in 'open space' – a condition where the Chikou Span would not intercept the bodies of any candlesticks over the next five to ten periods. That would occur on a daily close at or below $0.49.
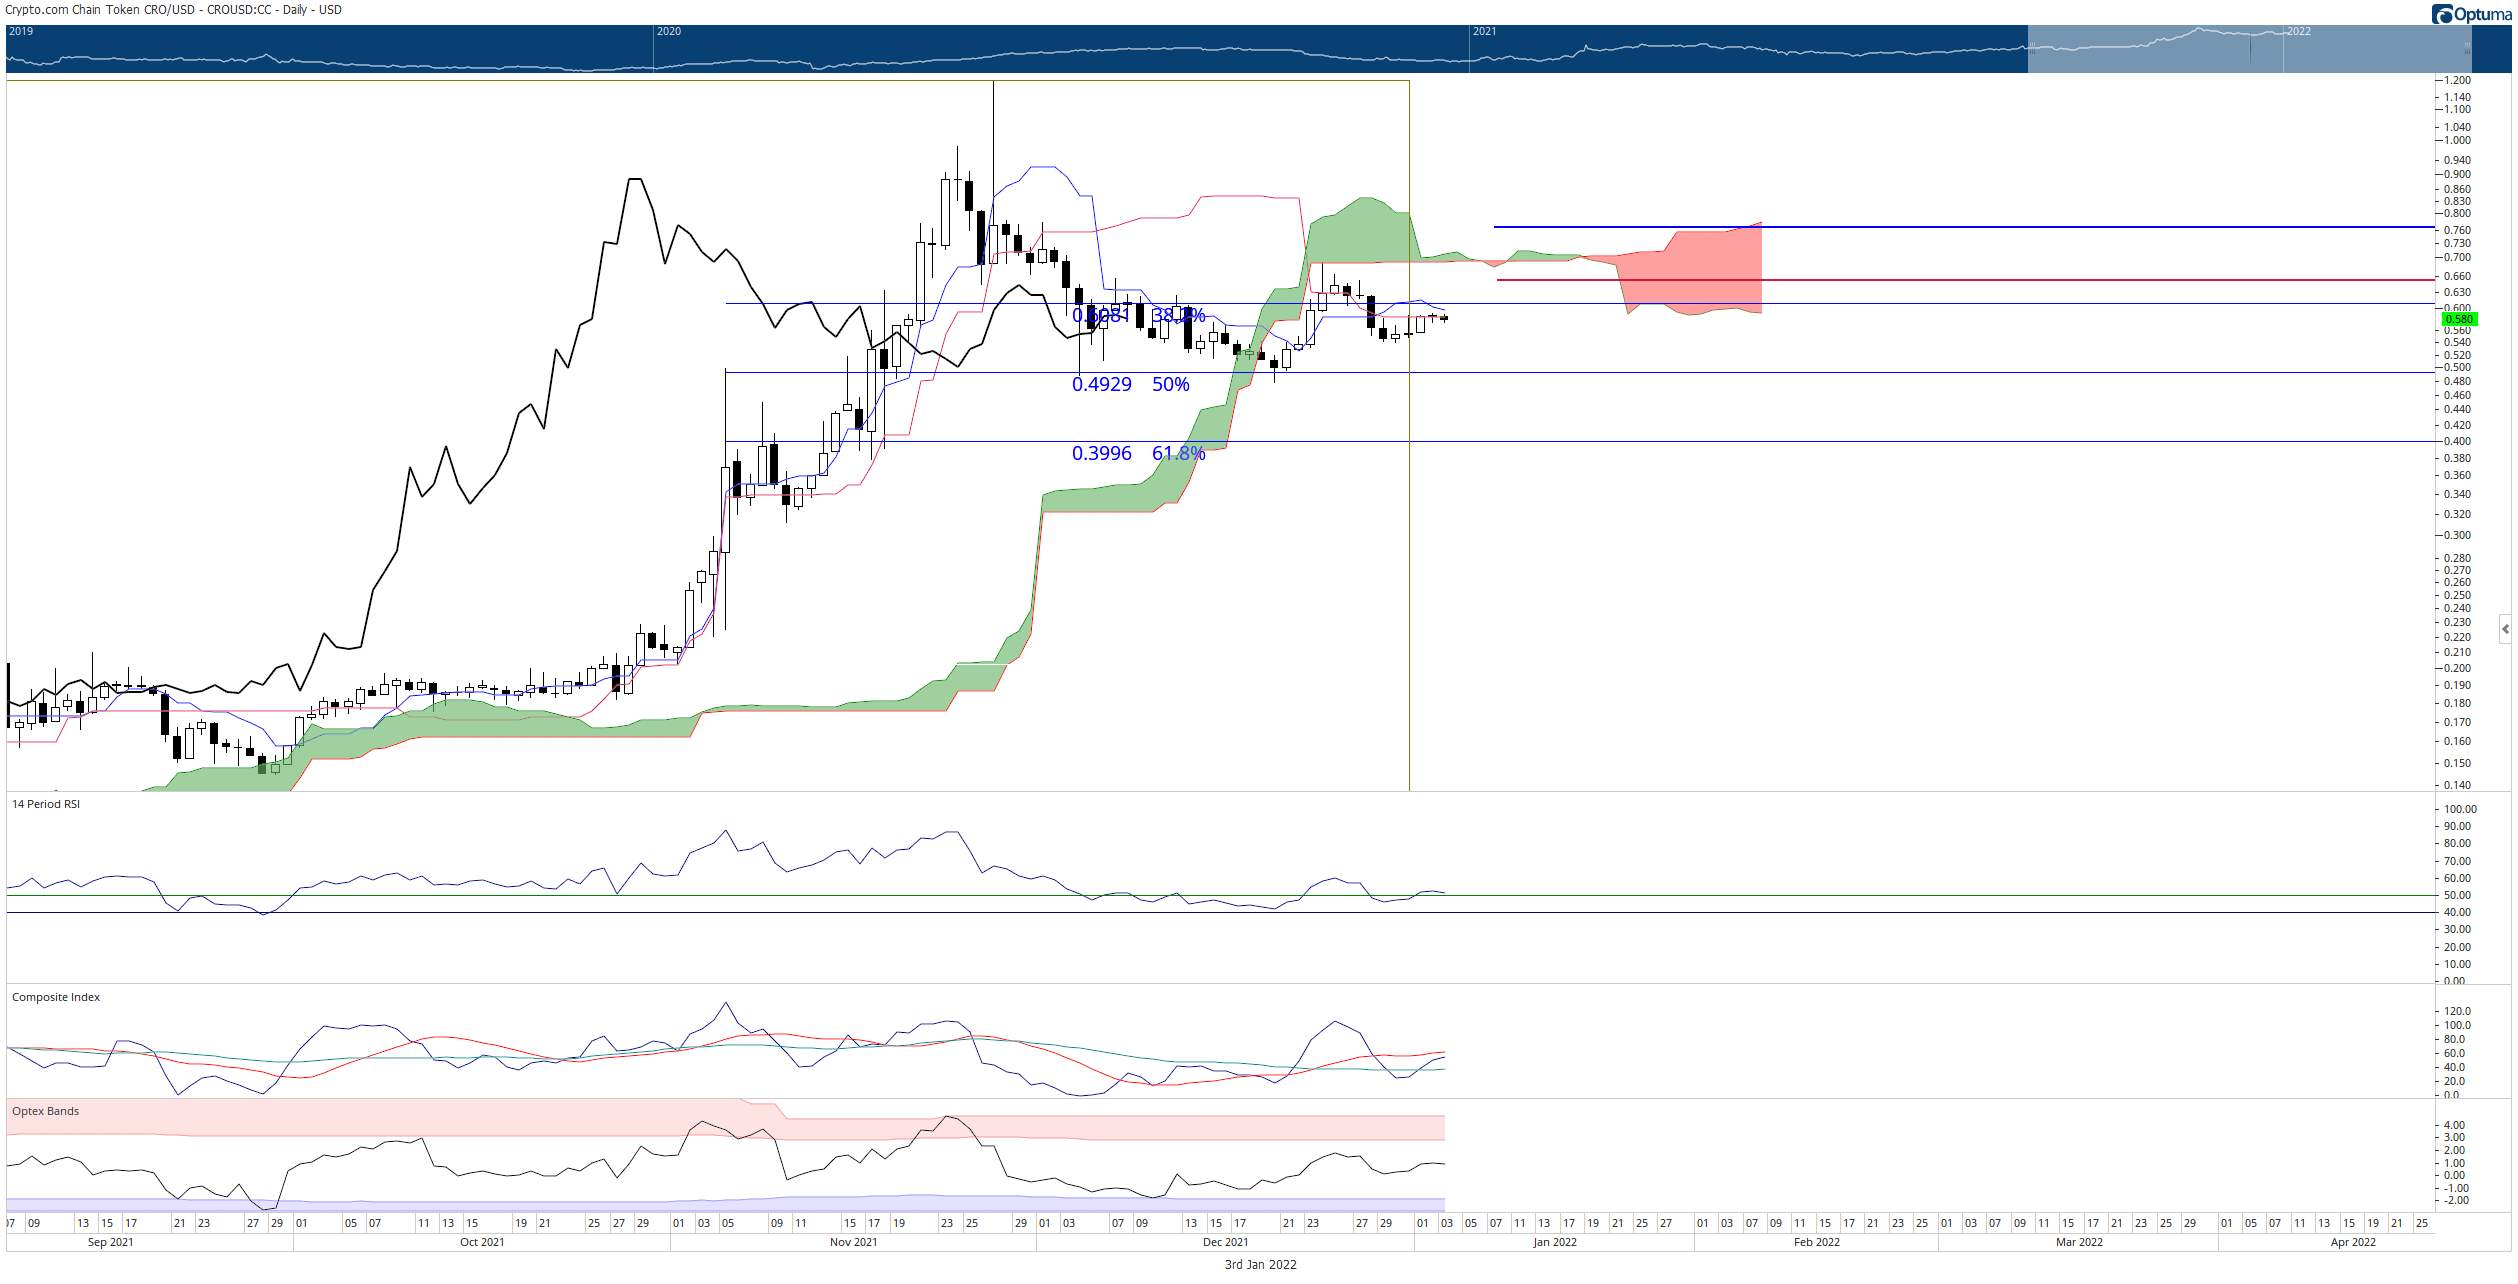
CRO/USD Daily Ichimoku Chart
It is essential, for bulls, that $0.50 hold as support to prevent a significant capitulation move south. The level at $0.50 is not only a potent psychological number, but it is the 50% Fibonacci retracement and the final high volume node in the 2021 Volume Profile until the next high volume node at $0.40 – the likely target area for shorts on any close at or below $0.49.
A clear bullish outlook within the Ichimoku Kinko Hyo system can only be achieved if CRO price has a close above the daily Cloud and weekly Tenkan-Sen at $0.81.
Author

Jonathan Morgan
Independent Analyst
Jonathan has been working as an Independent future, forex, and cryptocurrency trader and analyst for 8 years. He also has been writing for the past 5 years.



