Crypto update: Momentum tested, structure speaks

Crypto started the week with strength, confidence, and clean technical wins but…
The price is now pressing into areas where trends either prove themselves or quietly fail. This is no longer about chasing momentum. It’s about reading confirmation vs. rejection.
Bitcoin (BTC)
Earlier this week, bulls scored several important technical victories:
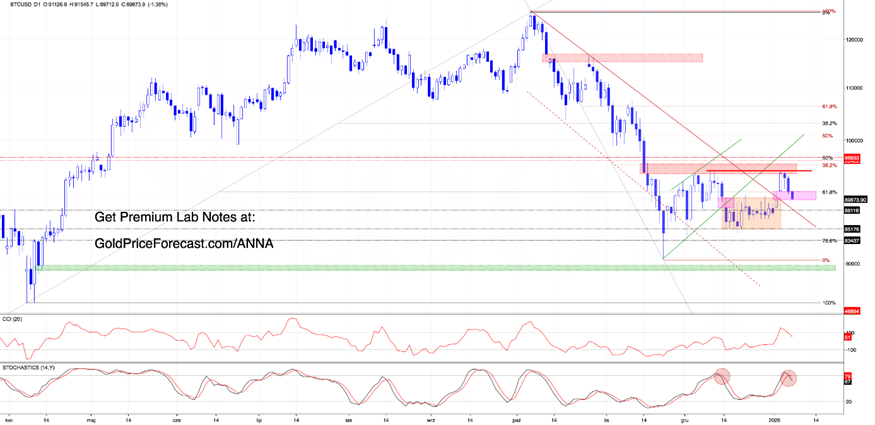
• a breakout above the orange consolidation
• a clean break of the red downtrend line
• and a bullish island reversal, formed by the gap from January 15 combined with Monday’s upside gap
That’s strong technical work.
However, the rally stalled - again - at the key red resistance zone (94,116-95,694). This marked the third rejection from that area, and price pulled back, sliding to the lower edge of Monday’s gap.
Why does this area matter?
If bears manage to close the day below 89,748, the bullish island reversal loses its power. In plain terms: the market tried to flip bullish and failed, which usually invites deeper testing.
On top of that, momentum indicators have rolled into sell signals, adding pressure and increasing the odds of a pullback toward the previously broken red trendline.
Bullish scenario:
If buyers defend that important support line, such price action will confirm the breakout (classic verification), and BTC will get another chance to attack the key resistance zone.
Bearish scenario:
A daily close below that support opens the door to:
• 85,176 (lower boundary of the orange consolidation)
• or even 83,437, which is the last stop before the psychological 80,000 level and last year’s lows
If Bitcoin is testing whether its breakout was real, Ethereum is quietly testing how much strength it actually has.
Ethereum (ETH)
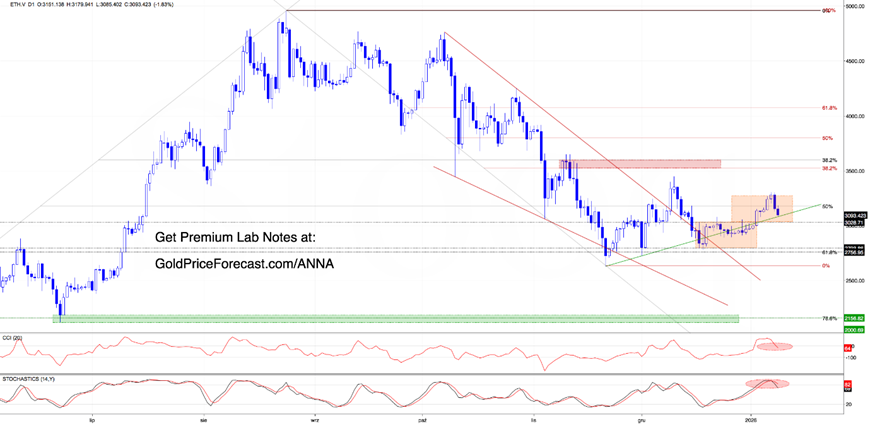
Ethereum showed more relative strength than Bitcoin in previous days, managing to hit the minimum upside target after breaking out of its consolidation.
But that’s where momentum faded.
Price failed to re-test prior highs, and momentum indicators flipped to sell, putting pressure on a key support - the green trendline that held price for over two weeks and defined the entire late-December consolidation.
If bears break below this line, attention shifts to:
• 3,027 → the previously broken upper border of the orange consolidation
• 2,757-2,794 → a major support zone built on the consolidation base and 61.8% Fibonacci retracement, which is the final buffer before last year’s lows
Takeaway: What to do right now?
This is not a chase environment. Bitcoin and Ethereum are both at decision points, where markets reveal intent but… only after confirmation.
Best approach today? Let price confirm support or rejection. Watch daily closes (not intraday noise) and respect momentum signals - they matter most at these levels.
Bottom Line: the market has shown its hand once. Now it needs to prove it meant it.
Stay sharp, stay tactical. And let confirmation do the heavy lifting.
Want free follow-ups to the above article and details not available to 99%+ investors? Sign up to our free newsletter today!
Author

Anna Radomska
Gold Price Forecast
Anna's passion for drawing evolved into a fascination with colorful lines and shapes, which later inspired her interest in the stock market.


