Crypto Today: Bitcoin reclaims $118,000, as Ethereum, XRP signal risk-off sentiment
- Bitcoin sweeps liquidity around the $117,116 support level and reignites a fresh rebound targeting $120,000.
- Ethereum retests support at $3,500 and recovers slightly, but bearish concerns remain amid diminishing technical strength.
- XRP faces a persistent sell-off backed by a declining RSI and a potential MACD indicator sell signal.

Cryptocurrencies are facing relatively strong headwinds on Thursday, particularly altcoins led by Ethereum (ETH) and Ripple (XRP). The largest smart contracts token is consolidating at around $3,630, marking a 6% decline from recent highs of $3,858. XRP extended the down leg to an intraday low of $2.95 before rising slightly to trade at $3.10 at the time of writing.
As for Bitcoin (BTC), a recovery is underway from support at $117,116 on Wednesday, with the short-term technical outlook starting to lean bullish, thereby revising the bid for a breakout past $120,000.
Market overview: BTC, ETH, XRP Open Interest cools
The derivatives market’s Open Interest (OI) is a key measure of investor interest in the crypto market. If closely monitored, traders can gain insight into the direction in which different assets are likely to move in the short term.
For instance, Bitcoin futures OI, which has maintained an overall downtrend in the past few days, stands at $83.55 billion compared to $87.89 billion recorded on July 15.
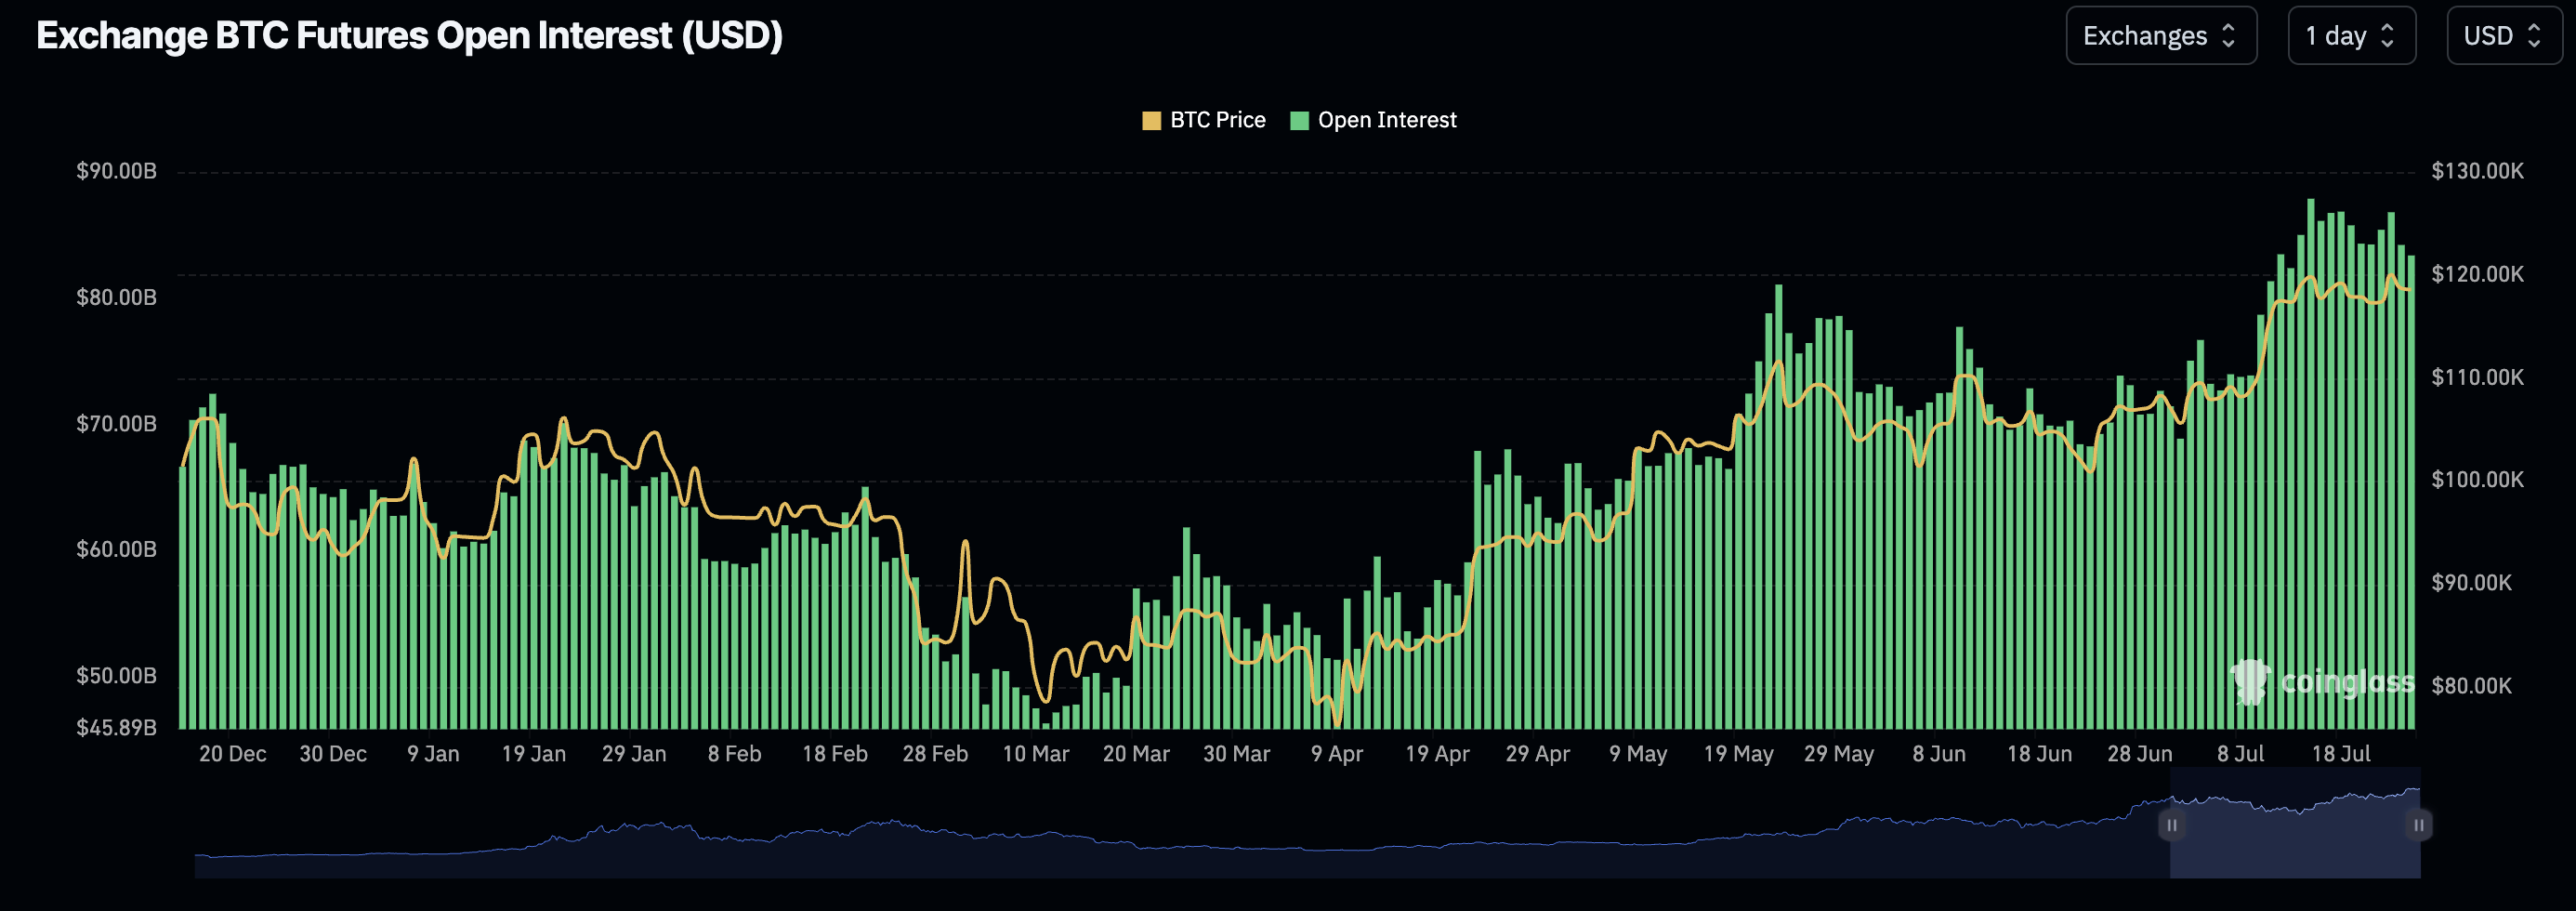
Bitcoin Futures Open Interest | Source: CoinGlass
The decline in OI mirrors Bitcoin’s suppressed upside price action, which tagged $120,090 on Wednesday before clawing back the accrued gains. If the decline persists, it would not be easy to sustain the uptrend eyeing levels toward the record high of $123,218.
Ethereum’s Open Interest is also cooling amid an upside-heavy technical outlook. According to CoinGlass, this fundamental metric has declined for two consecutive days, averaging $53.50 billion, down from $57.69 billion recorded on Tuesday. Ethereum could flip the path of resistance downward if OI continues to shrink, reflecting dwindling confidence and risk-off sentiment.
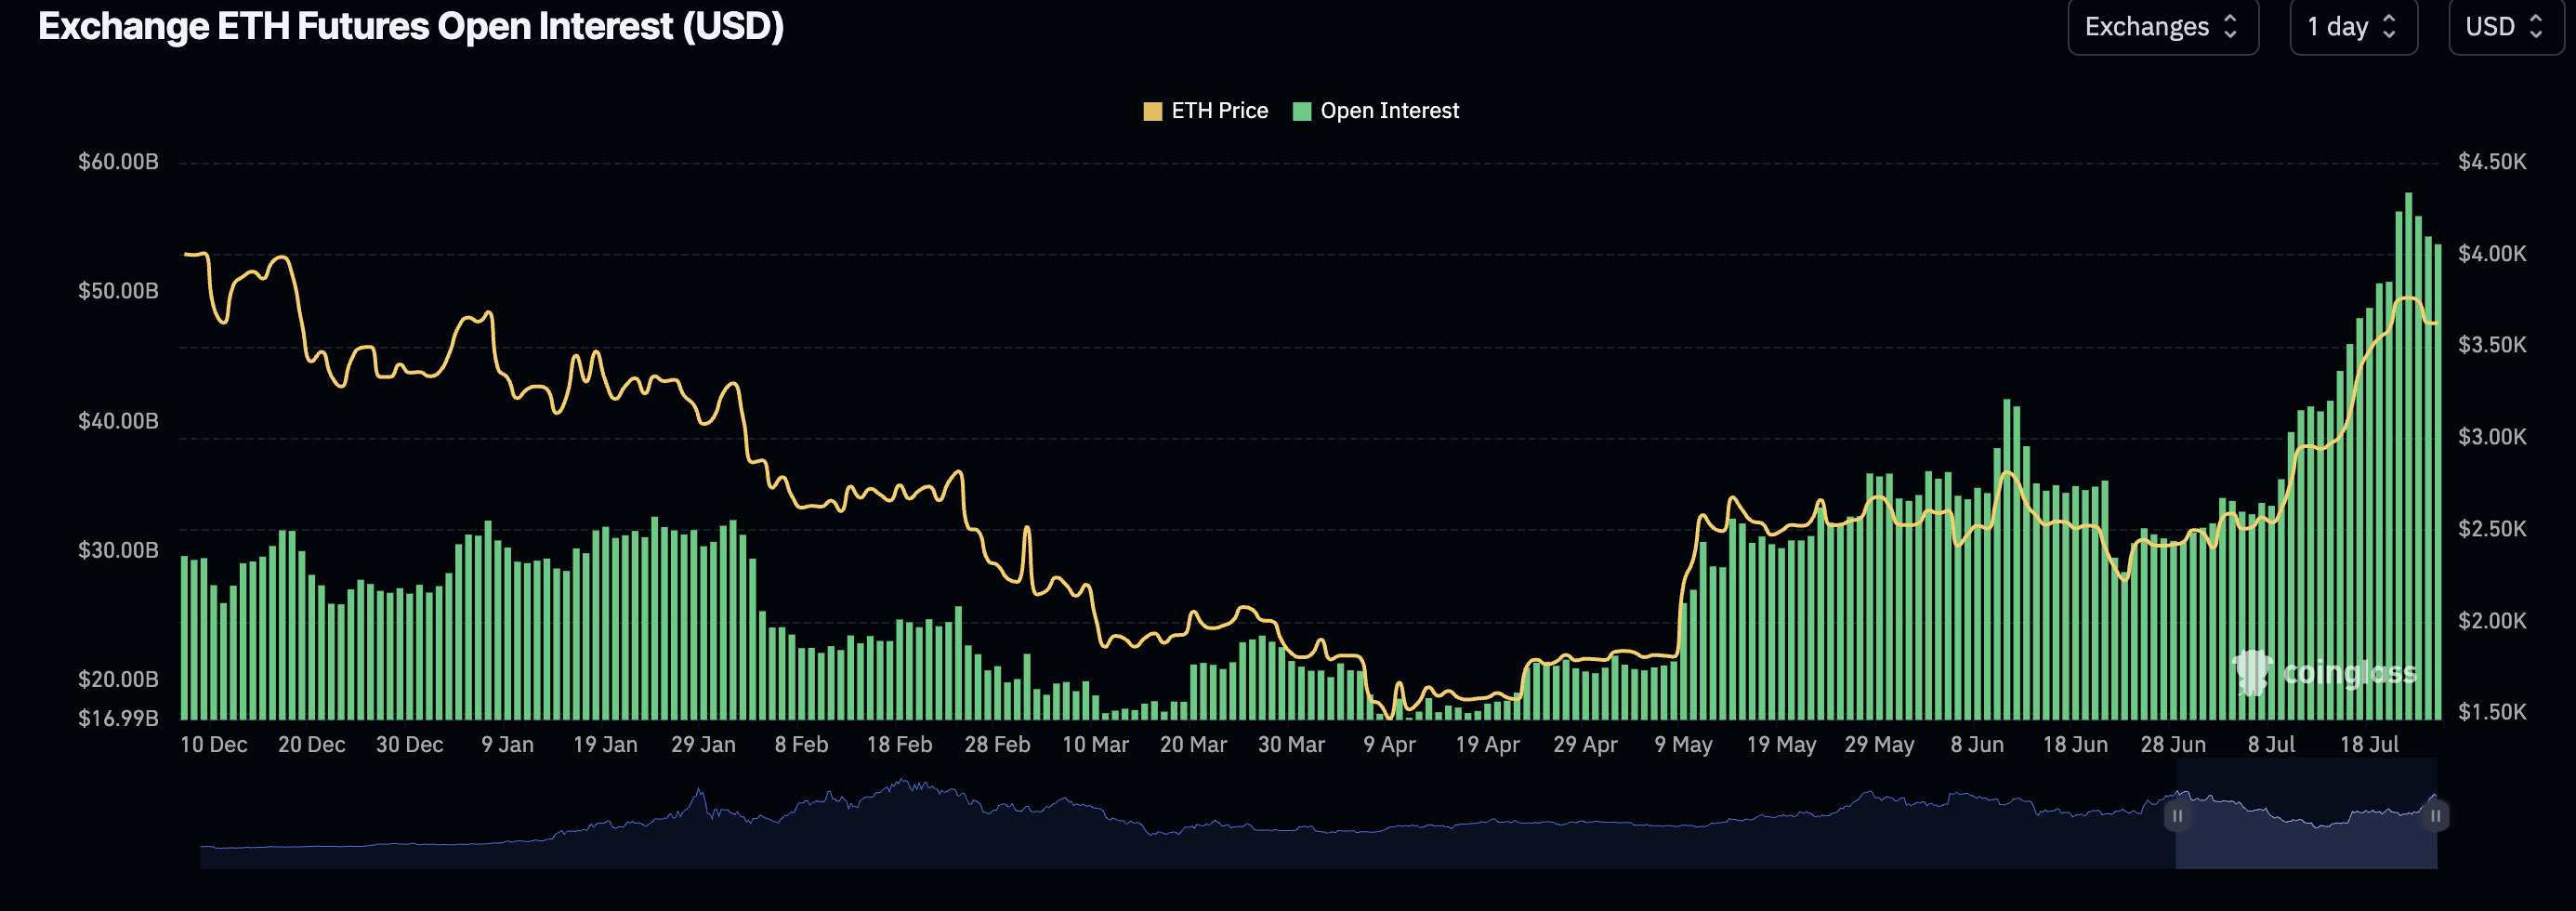
Ethereum Futures Open Interest | Source: CoinGlass
XRP futures OI is experiencing a steeper drop after the price hit a new record high of $3.66 on Friday. As shown in the chart below, OI currently averages $9.27 billion, down 15% from $10.94 billion recorded on Tuesday.
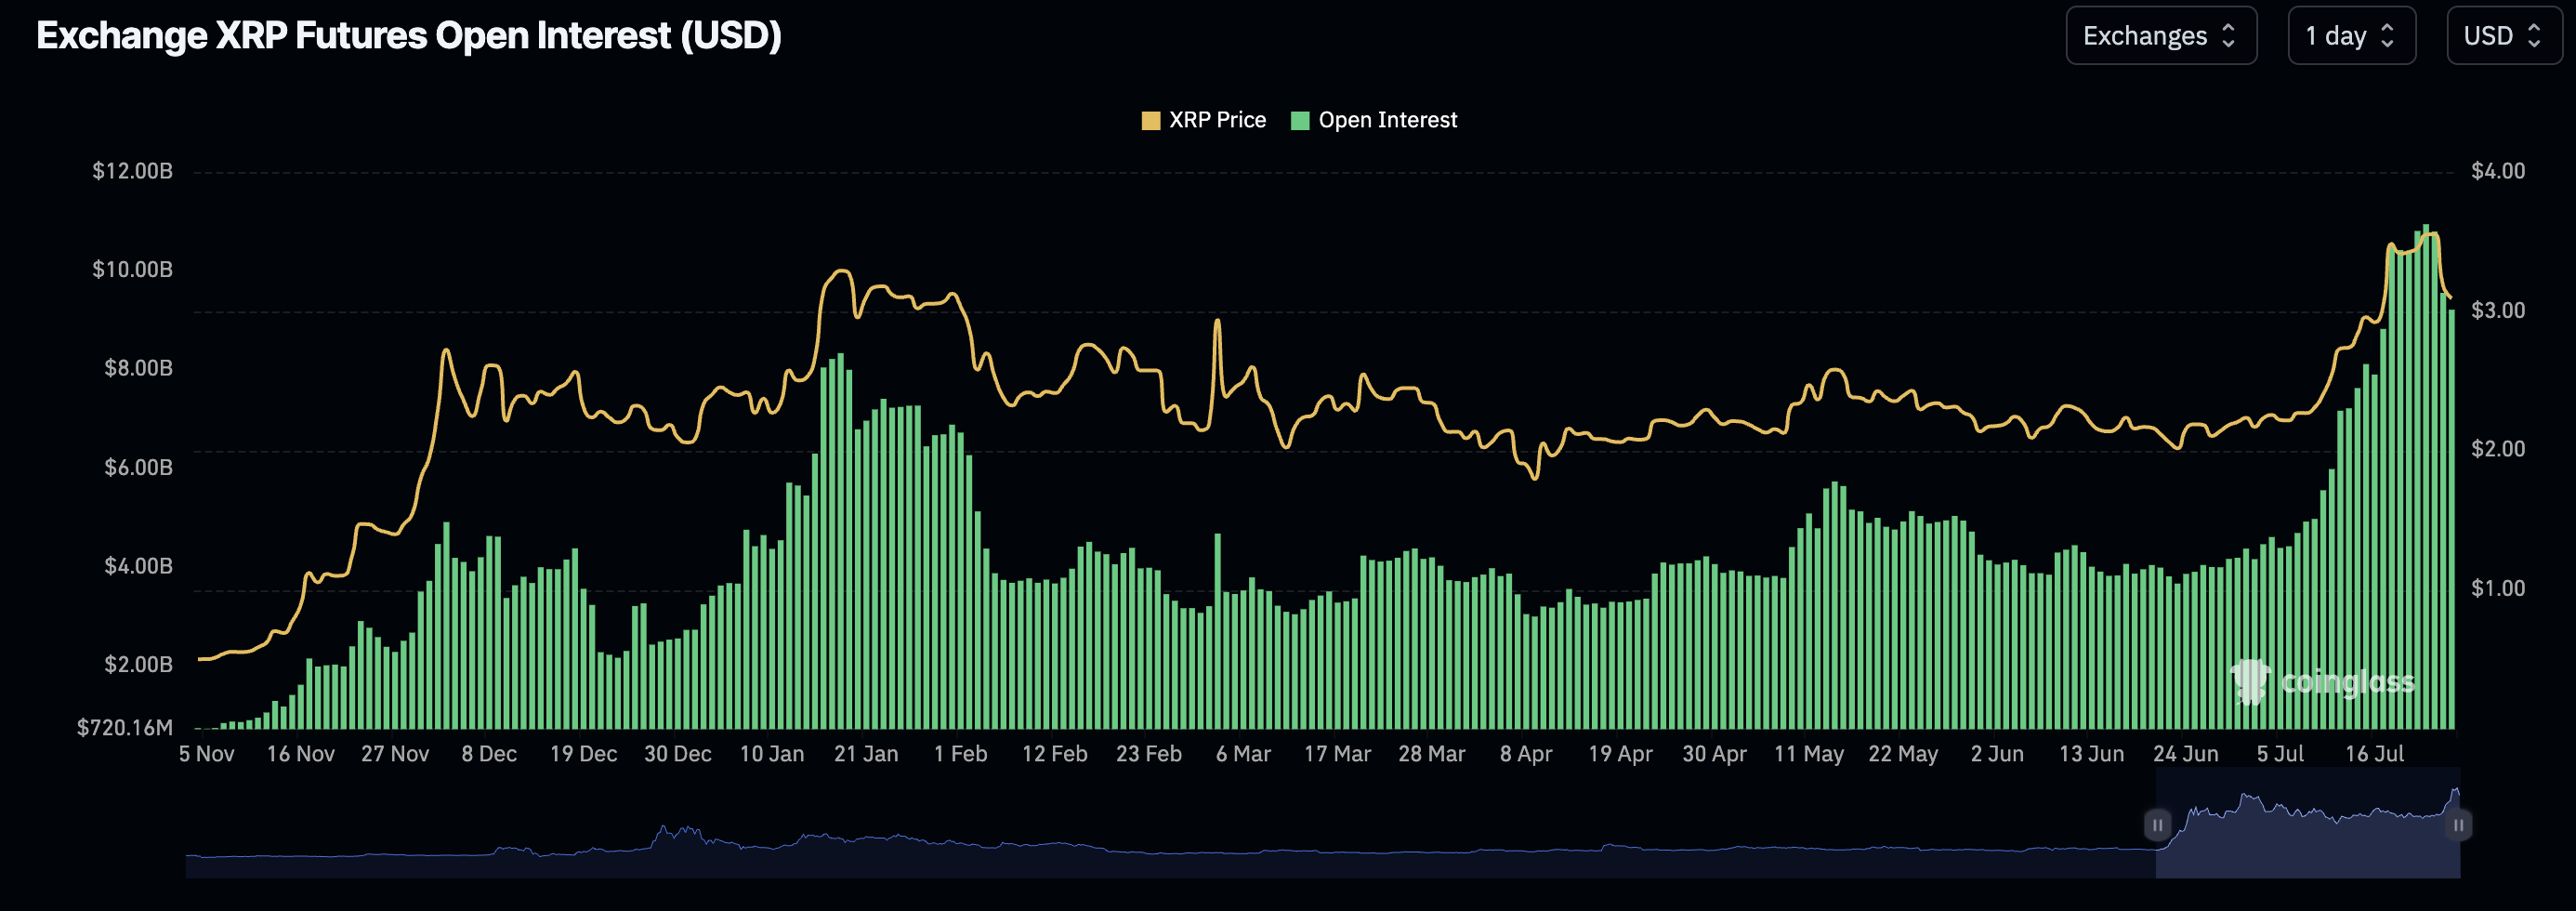
Futures Open Interest | Source: CoinGlass
Chart of the Day: Can Bitcoin break out following consolidation?
Bitcoin price sits above short-term support at $118,000, after rebounding from $117,116. The Relative Strength Index (RSI), currently moving relatively sideways around 52, indicates neutral momentum in the market and suggests the possibility of a consolidation period ahead of the next attempt to recover past $120,000.
Notably, key moving averages hold significantly below the price of BTC on the 8-hour chart, affirming a mid-term bullish structure. In the event of a reversal, the 50-period Exponential Moving Average (EMA) at $ 116,462, the 100-period EMA at $113,382, and the 200-period EMA at $109,013 could serve as tentative support levels.
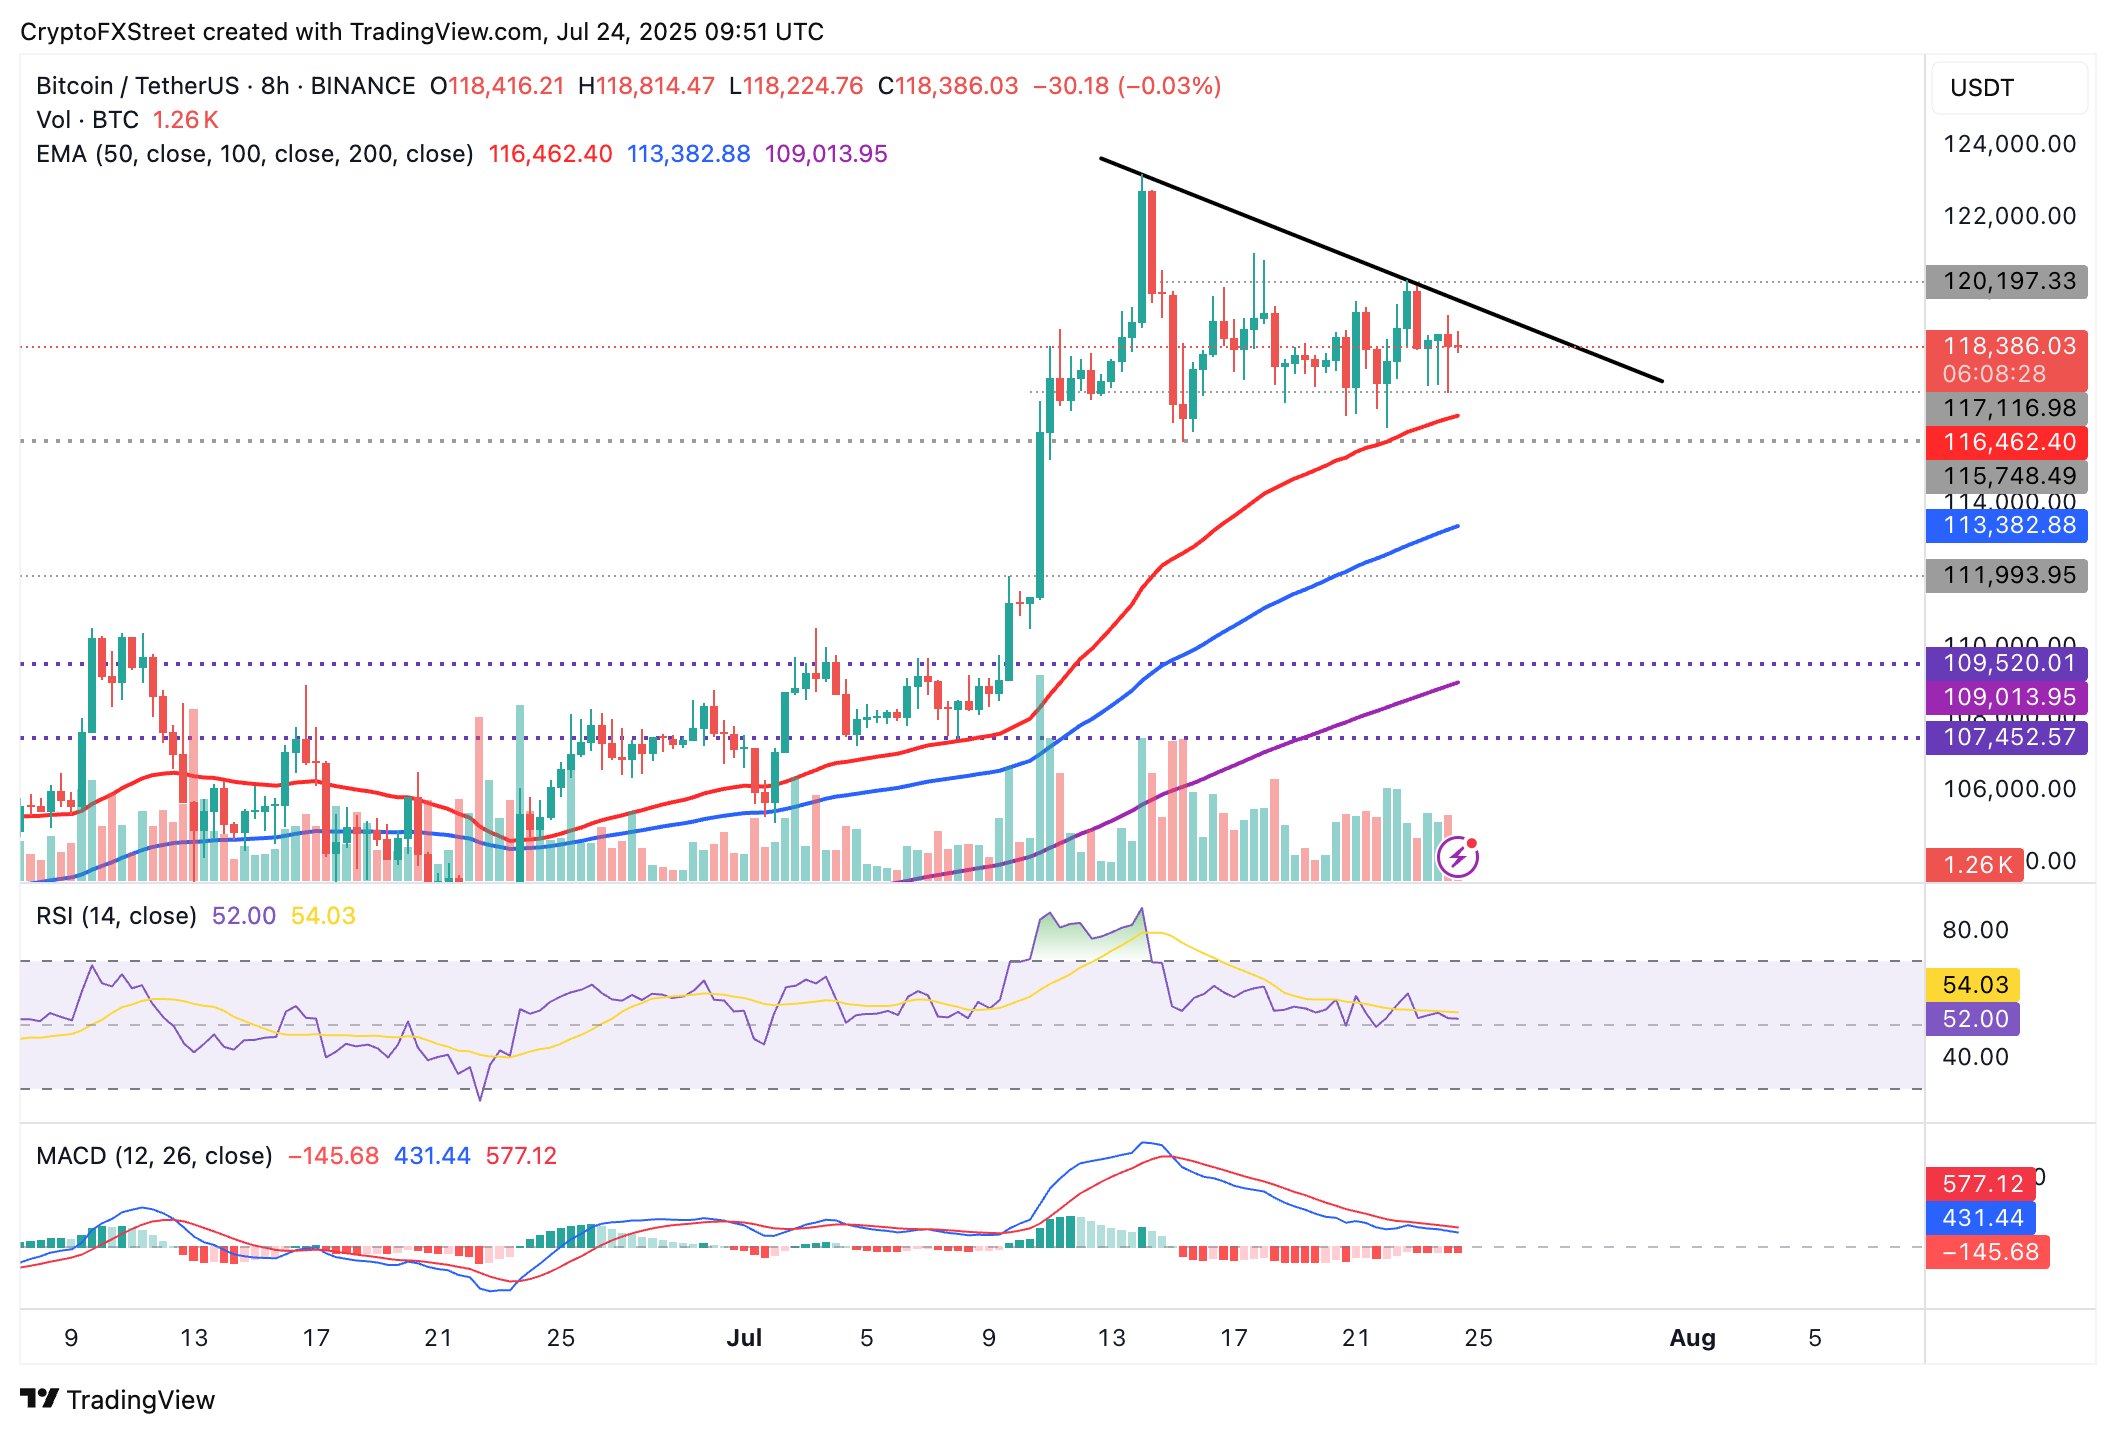
BTC/USDT 8-hour chart
Still, traders should be aware of the short-term sell signal maintained by the Moving Average Convergence Divergence (MACD) indicator since July 15. If the signal persists with the blue MACD line holding below the red signal line while the indicator generally slopes downward, Bitcoin price could retrace further, as investors reduce exposure.
Altcoins update: Ethereum, XRP hold above key support
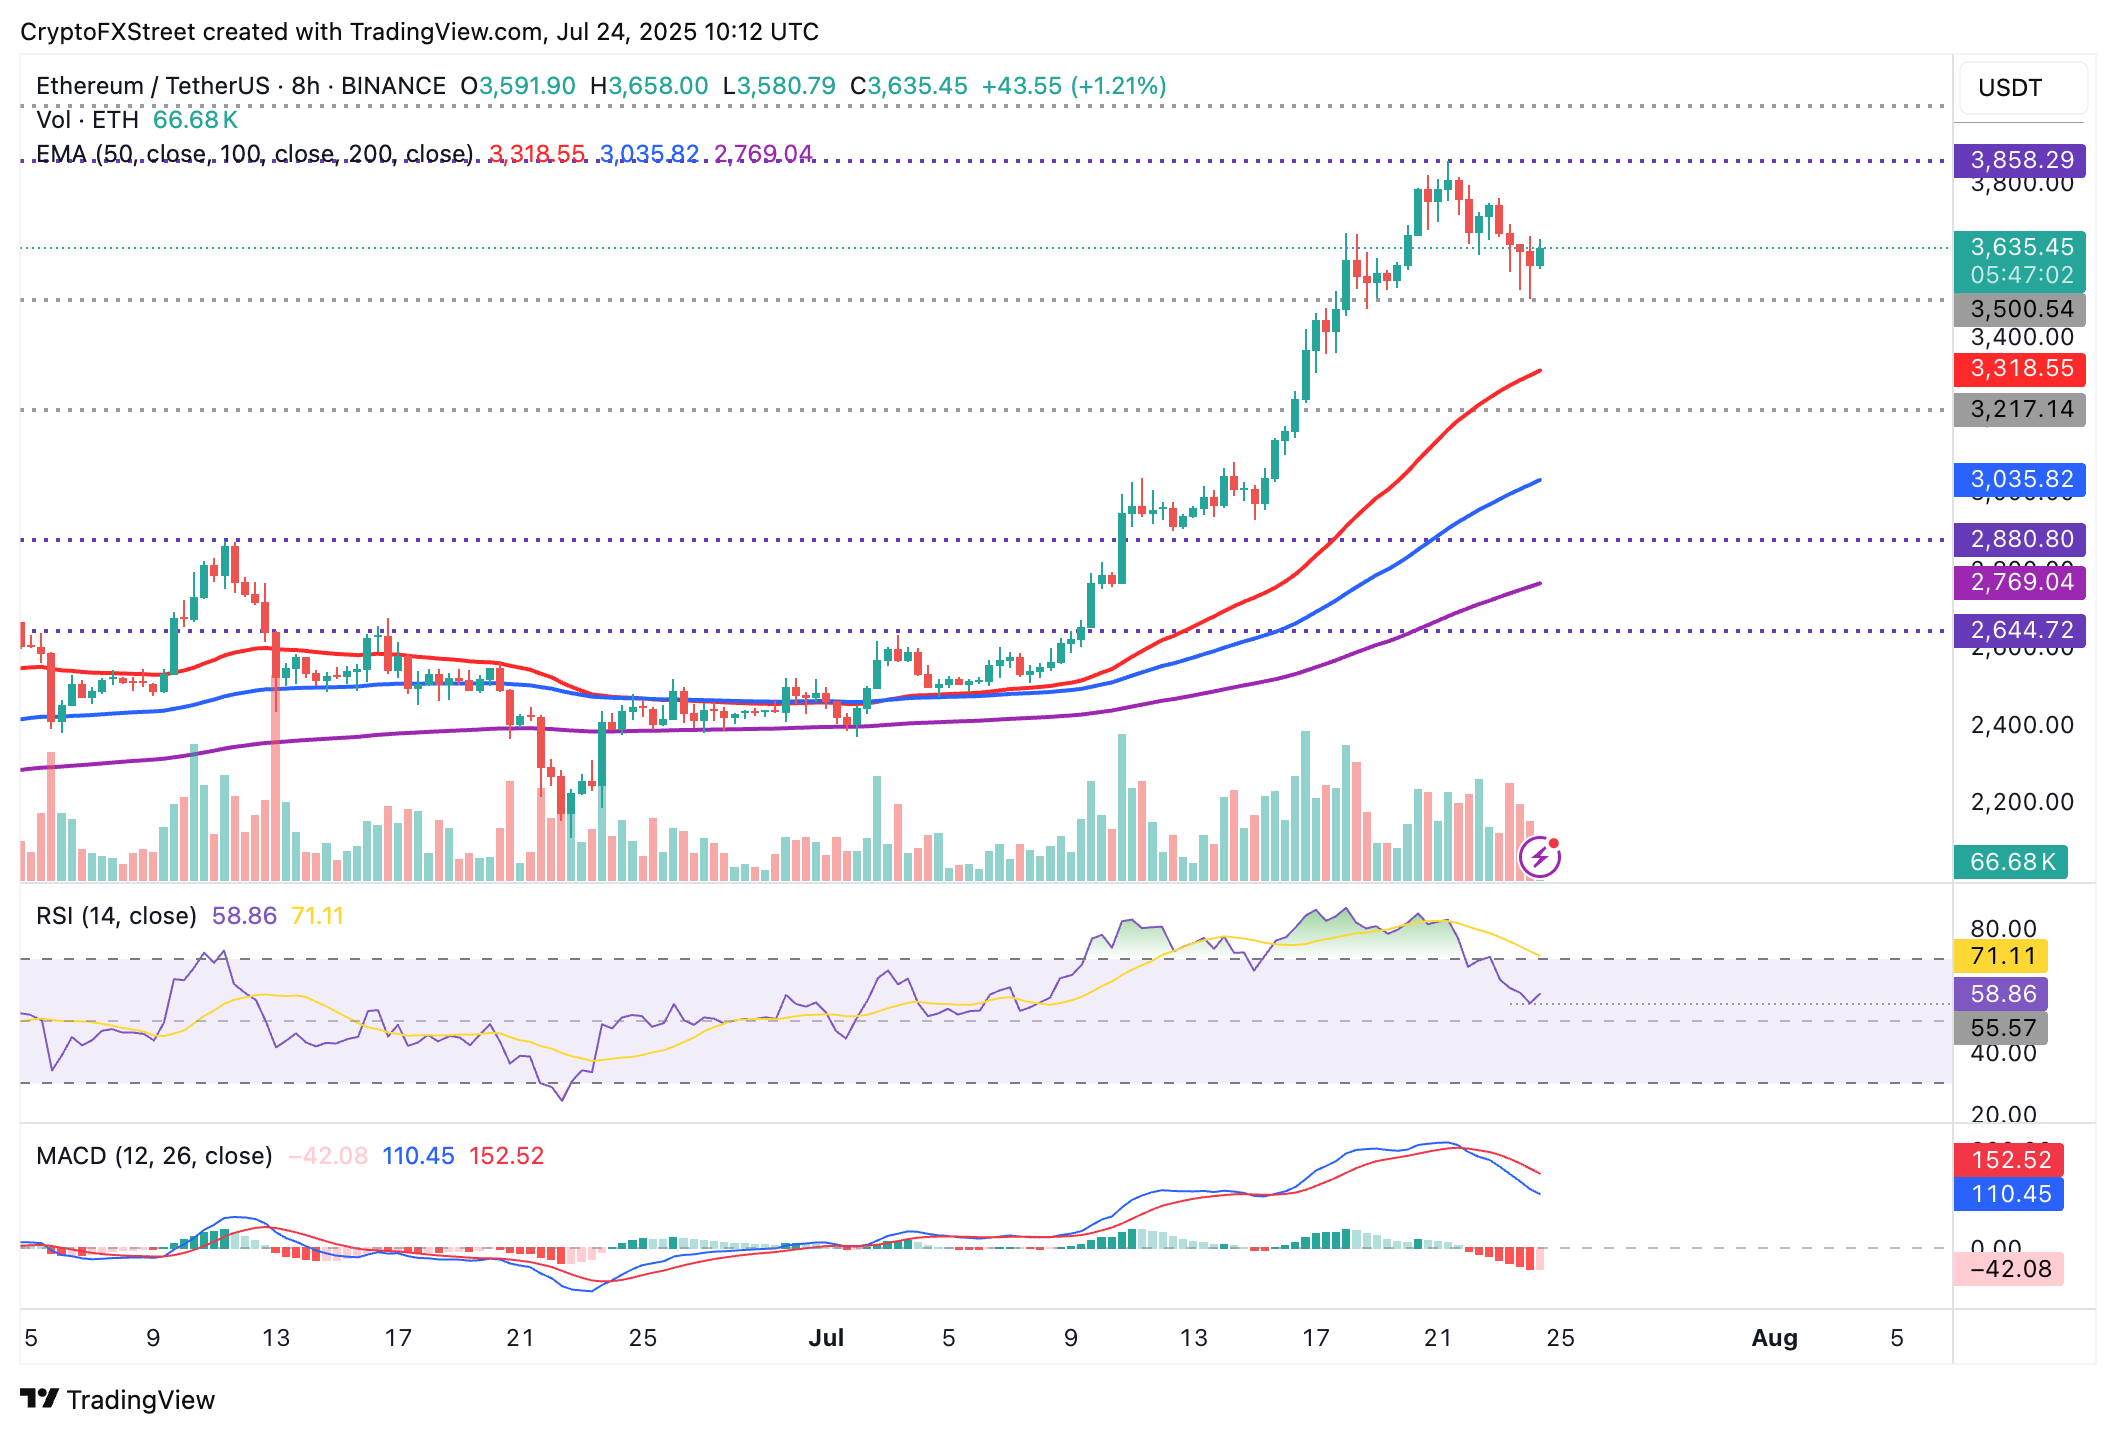
Ethereum price is nurturing a recovery after retesting support near $3,500 during the Asian session. The upward-looking RSI at 60 on the 8-hour chart follows a drop to 55, indicating that buying pressure is increasing and could help sustain the recovery.
Traders are eyeing a breakout above its recent high of $3,858, followed by a potential extension past $4,000.
However, with the Open Interest cooling in the derivatives market, the upswing could be delayed, favoring consolidation above support at $3,500 in the near term. Moreover, a sell signal from the MACD could prompt investors to reduce their exposure, contributing to overhead pressure. Hence, there’s a need to monitor for tentative support areas such as the 50-period EMA at $3,318, the 100-period EMA at $3,035 and the 200-period EMA at $2,769 on the 8-hour chart.
ETH/USDT 8-hour chart
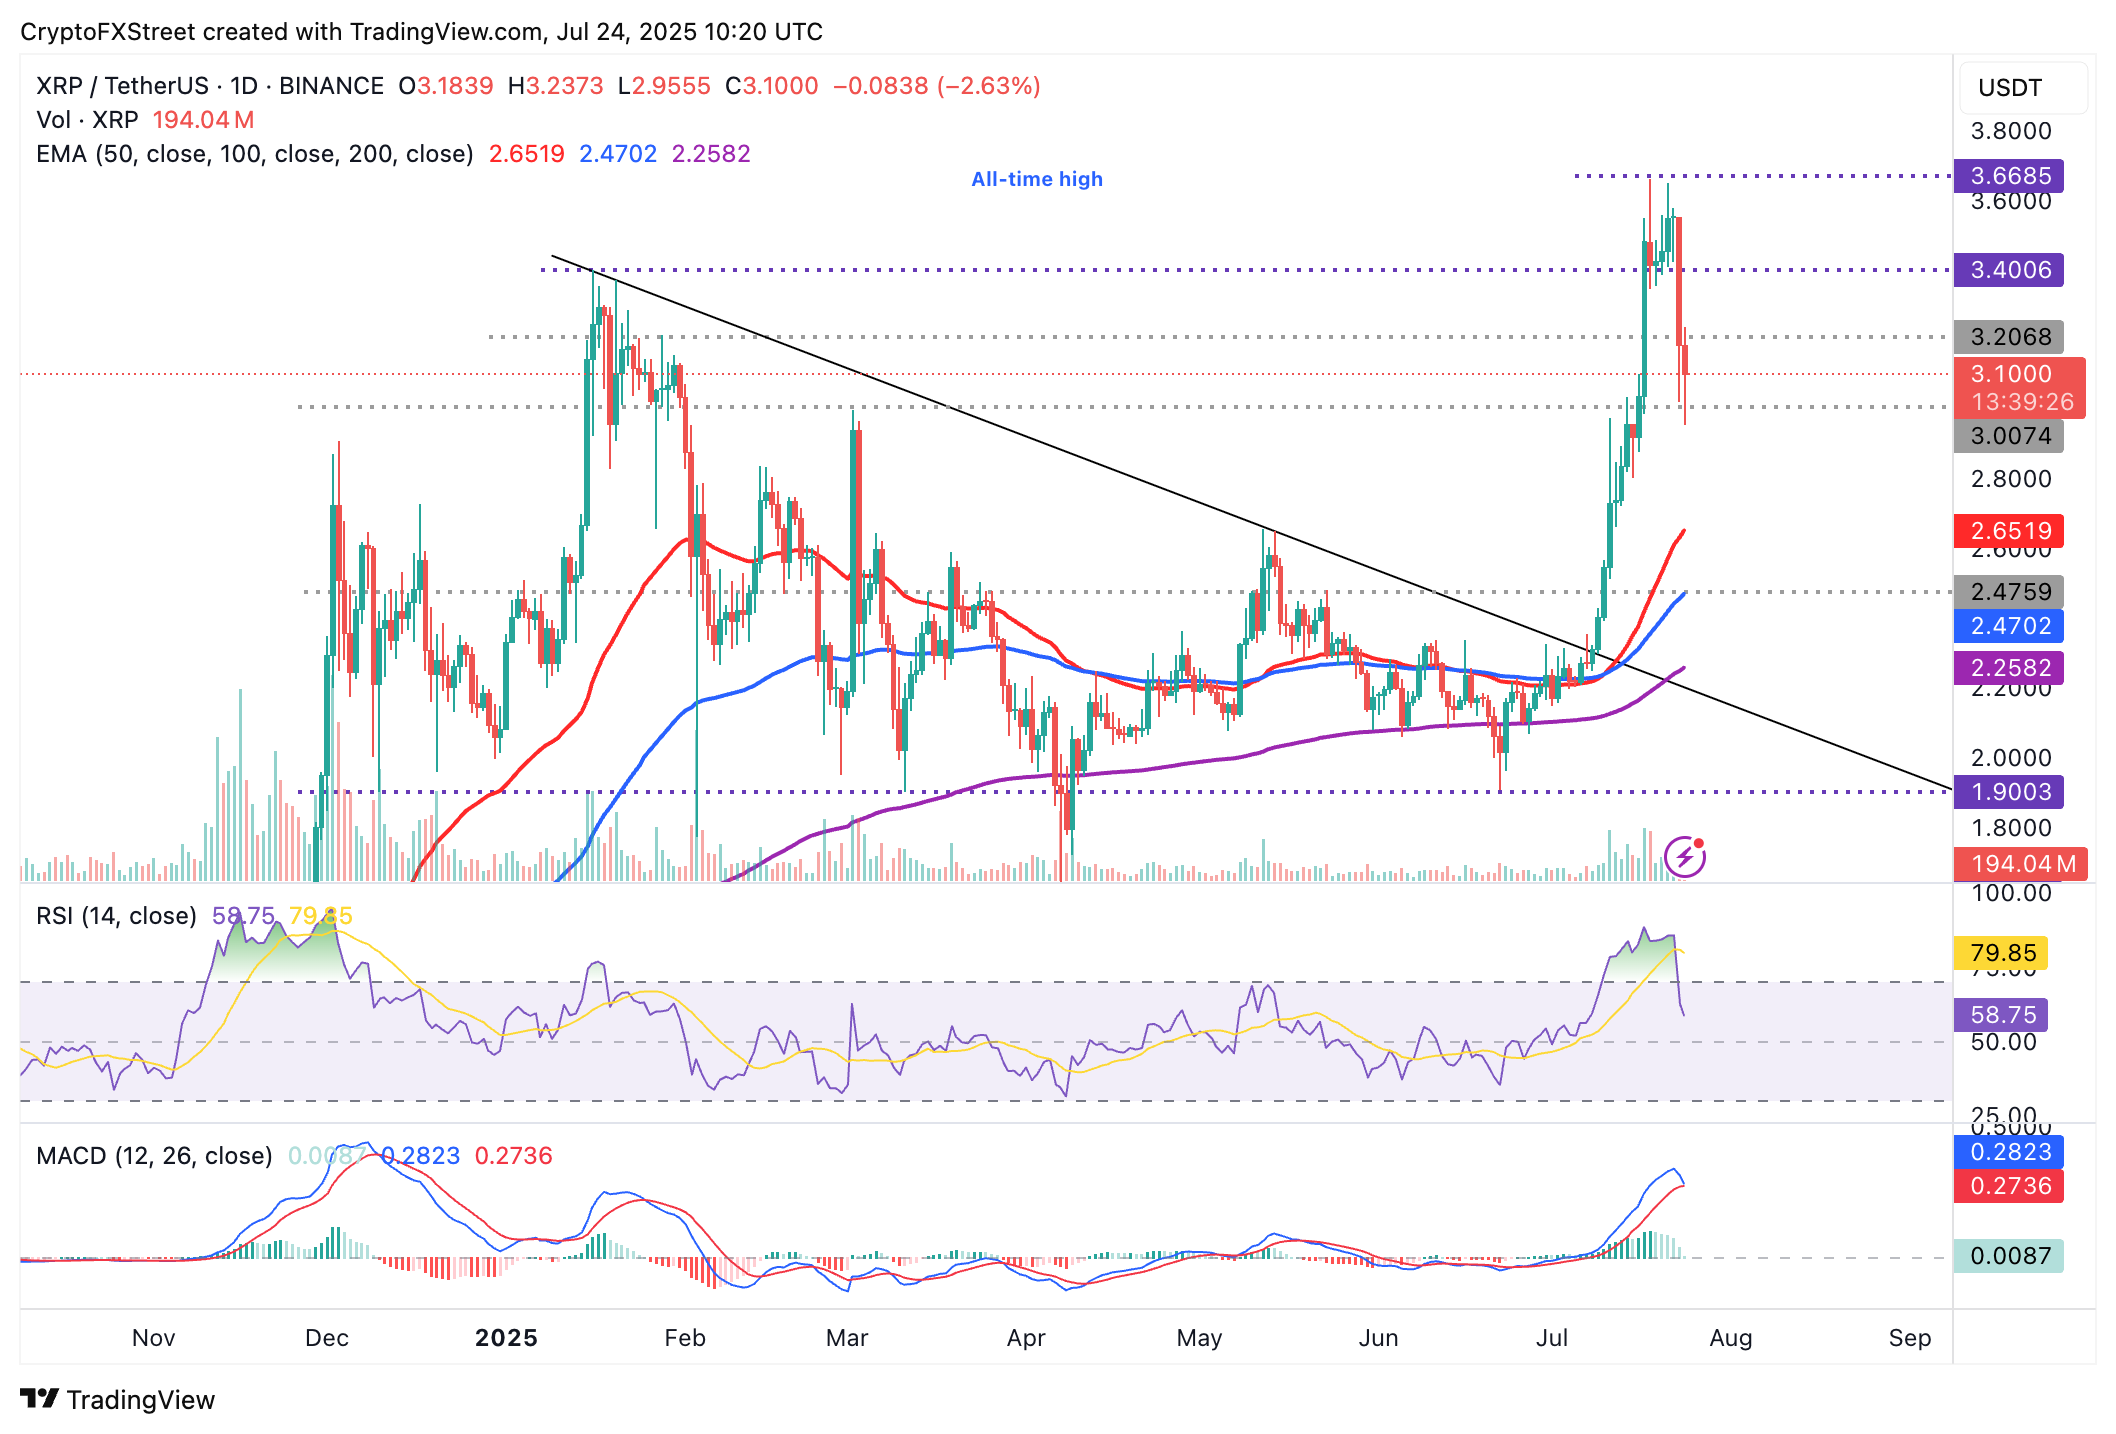
As for XRP, bears appear to be largely in control, following the correction from the record high of $3.66, which has tested $2.95 as support. A sharp decline in the RSI from extremely overbought conditions at 88 to 59 at the time of writing indicates diminishing bullish momentum as selling accelerates.
XRP/USDT daily chart
Traders should watch for a likely sell signal from the MACD indicator in upcoming sessions. This indicator triggers a sell signal when the blue MACD line crosses and settles below the red signal line.
Other key elements used to confirm the possibility of the price dropping include an overall downward slope of the indicator and red histogram bars growing below the zero line.
If the decline accelerates below $2.95, the 50-day EMA at $2.65, the 100-day EMA at $2.47, and the 200-day EMA at $2.25 would emerge as key tentative support levels to absorb selling pressure.
Bitcoin, altcoins, stablecoins FAQs
Bitcoin is the largest cryptocurrency by market capitalization, a virtual currency designed to serve as money. This form of payment cannot be controlled by any one person, group, or entity, which eliminates the need for third-party participation during financial transactions.
Altcoins are any cryptocurrency apart from Bitcoin, but some also regard Ethereum as a non-altcoin because it is from these two cryptocurrencies that forking happens. If this is true, then Litecoin is the first altcoin, forked from the Bitcoin protocol and, therefore, an “improved” version of it.
Stablecoins are cryptocurrencies designed to have a stable price, with their value backed by a reserve of the asset it represents. To achieve this, the value of any one stablecoin is pegged to a commodity or financial instrument, such as the US Dollar (USD), with its supply regulated by an algorithm or demand. The main goal of stablecoins is to provide an on/off-ramp for investors willing to trade and invest in cryptocurrencies. Stablecoins also allow investors to store value since cryptocurrencies, in general, are subject to volatility.
Bitcoin dominance is the ratio of Bitcoin's market capitalization to the total market capitalization of all cryptocurrencies combined. It provides a clear picture of Bitcoin’s interest among investors. A high BTC dominance typically happens before and during a bull run, in which investors resort to investing in relatively stable and high market capitalization cryptocurrency like Bitcoin. A drop in BTC dominance usually means that investors are moving their capital and/or profits to altcoins in a quest for higher returns, which usually triggers an explosion of altcoin rallies.
Author

John Isige
FXStreet
John Isige is a seasoned cryptocurrency journalist and markets analyst committed to delivering high-quality, actionable insights tailored to traders, investors, and crypto enthusiasts. He enjoys deep dives into emerging Web3 tren


