Crypto Today: Bitcoin eyes $118,000, Ethereum $3,800, XRP $3.30 as speculative demand builds
- Bitcoin bulls are pushing to breach the $115,000 resistance, aiming for $118,000, backed by broadly steady demand.
- Ethereum recovers above $3,500 as bulls target $3,800, underpinned by 12 consecutive weeks of spot ETF inflows.
- XRP reclaims $3.00 support as the RSI lifts above the midline.

Cryptocurrency prices are broadly recovering on Monday in the wake of last week’s volatility and sell-off. Bitcoin (BTC), which plummeted to lows of $111,886 on Saturday, has regained momentum, approaching the short-term $115,000 hurdle.
Leading altcoins, including Ethereum (ETH) and Ripple (XRP), are also edging higher on Monday, backed by a gradual return of risk-on sentiment. The largest smart contracts token, ETH, holds above $3,500 support, as bulls push toward the $3,800 target.
Market overview: BTC, ETH, XRP rebound after profit-taking and hawkish Fed signals
Investors remained on the edge last week amid the release of key United States (US) economic data, interest rate decision and the announcement of President Trump’s higher tariffs on Friday.
“The week started strong, with US$883 million in inflows, but this trend reversed in the latter half of the week, likely triggered by the hawkish FOMC meeting and a series of better-than-expected economic data from the US,” the CoinShares report highlights.
Crypto investment products largely experienced outflows, led by Bitcoin with $404 million, according to a CoinShares report released on Monday. Cumulatively, digital investment products saw $223 million in outflows last week.
Ethereum fundamentals remained mainly positive, with related financial investment products posting their 15th consecutive week of inflows, totalling $134 million. Other assets that recorded net inflows included XRP and Solana (SOL) at $31.3 million and $8.8 million, respectively.
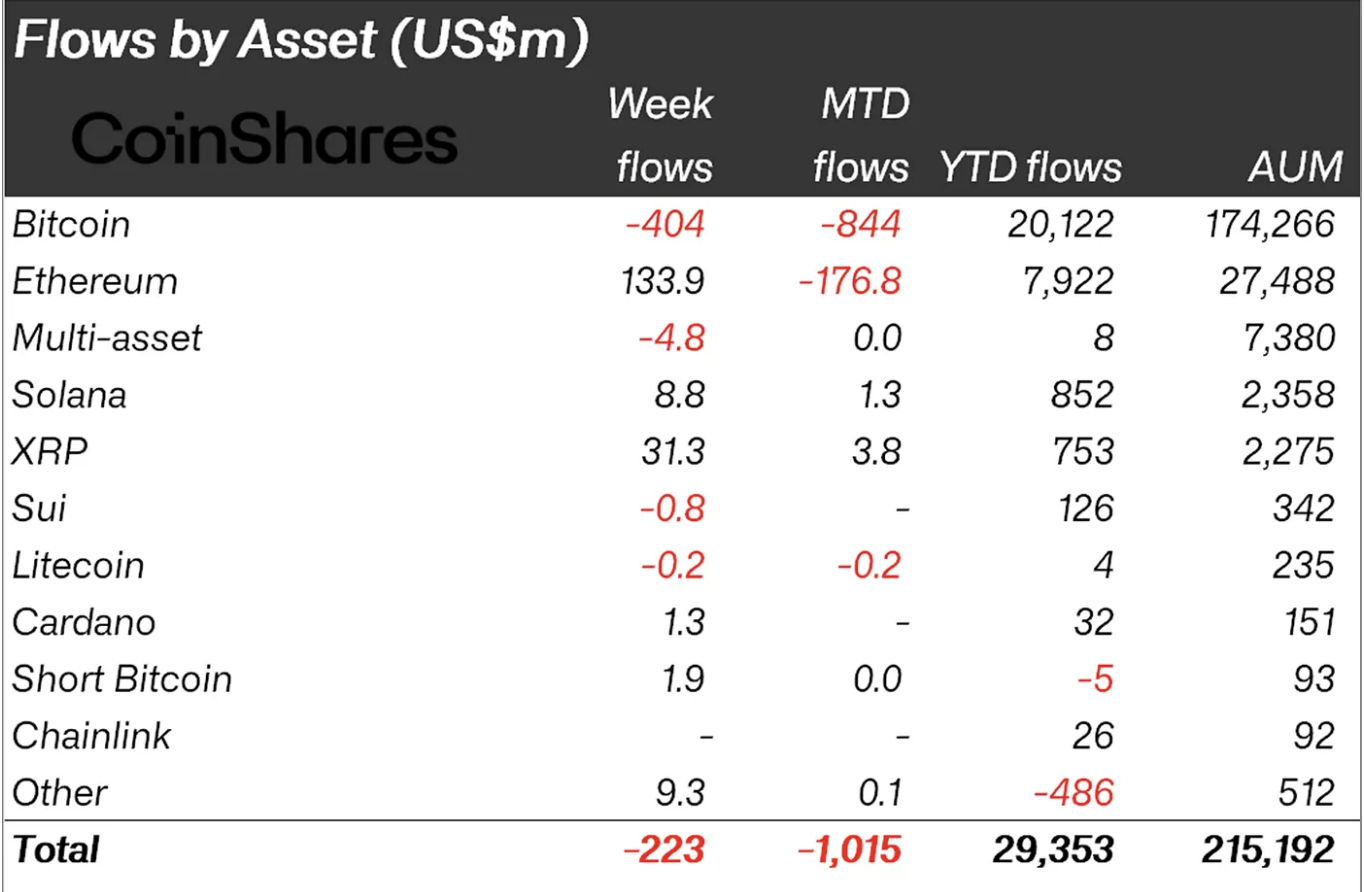
Digital investment products inflows | Source: CoinShares
Data spotlight: Ethereum sustains spot ETF inflows
Ethereum spot Exchange Traded Funds (ETFs) extended the bullish streak, recording 12 weeks of consecutive inflows. SoSoValue data shows $154 million in inflows last week, but significantly below the $1.85 million seen the previous week.
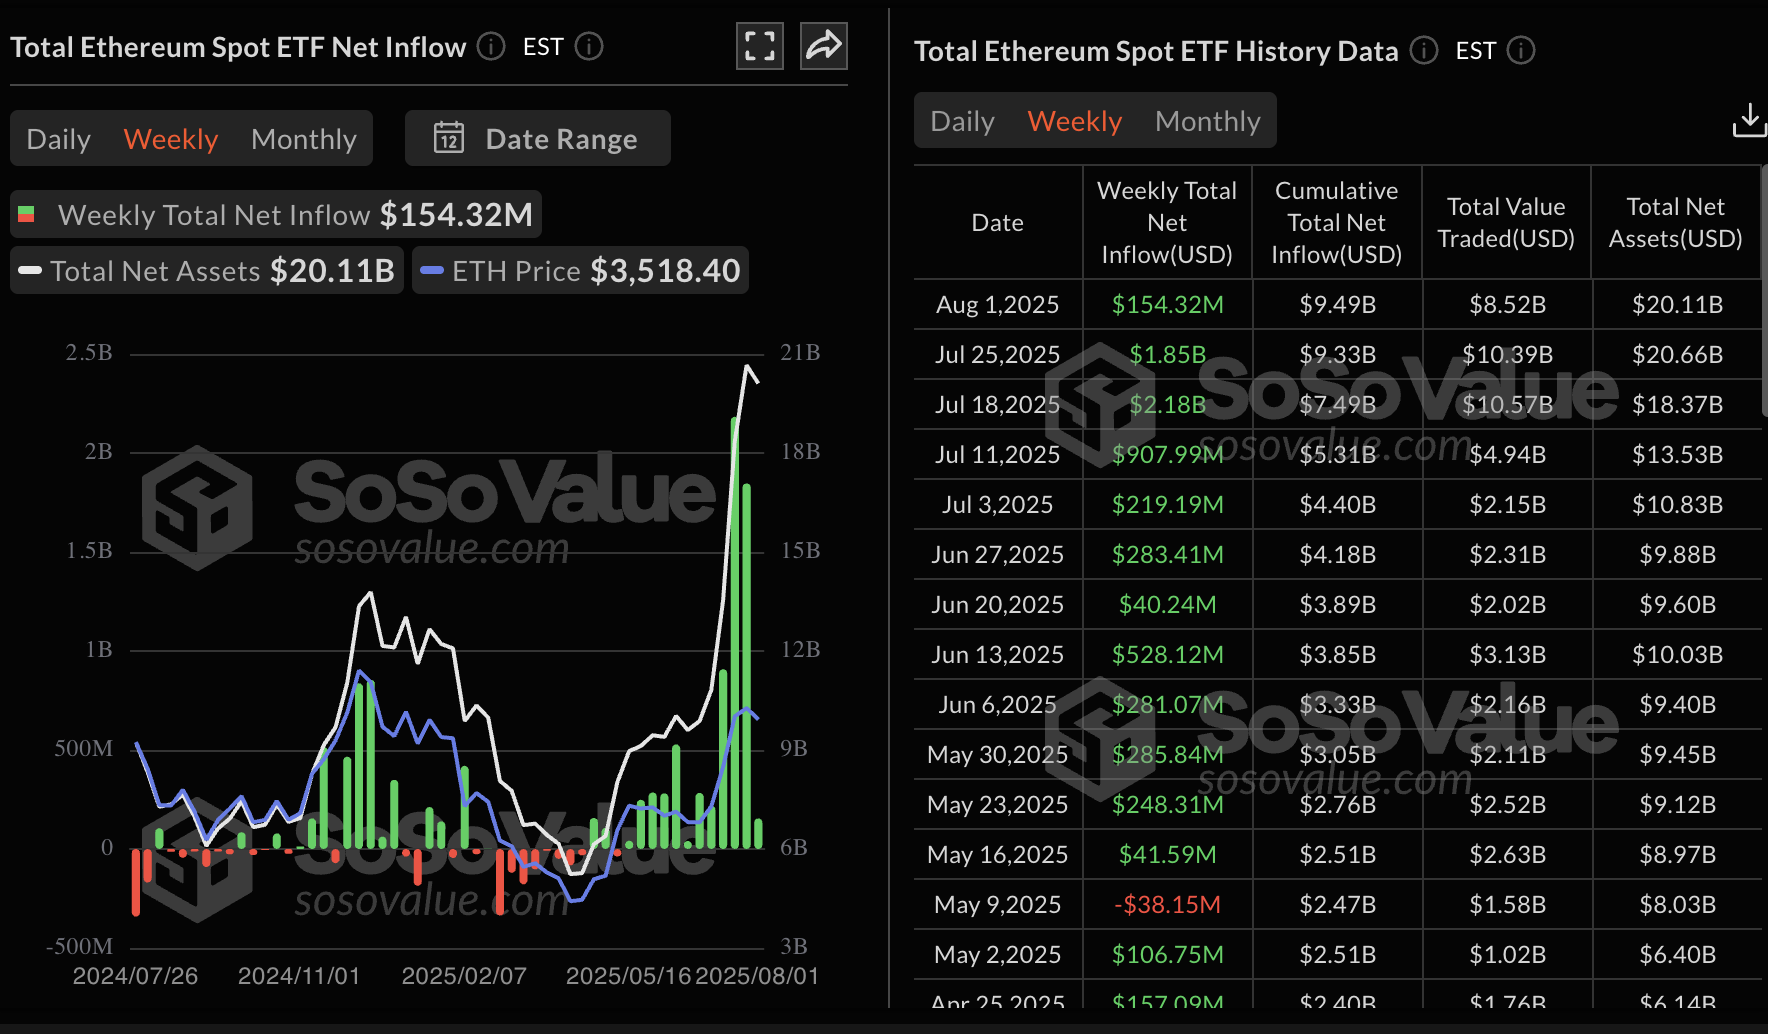
Ethereum spot ETF data | Source: SoSoValue
As for Bitcoin spot ETFs, outflows continued for the second day in a row, averaging $812 million on Friday. Bitcoin broke its seven-week bullish streak, with outflows totalling $643 million, as shown on the chart below.
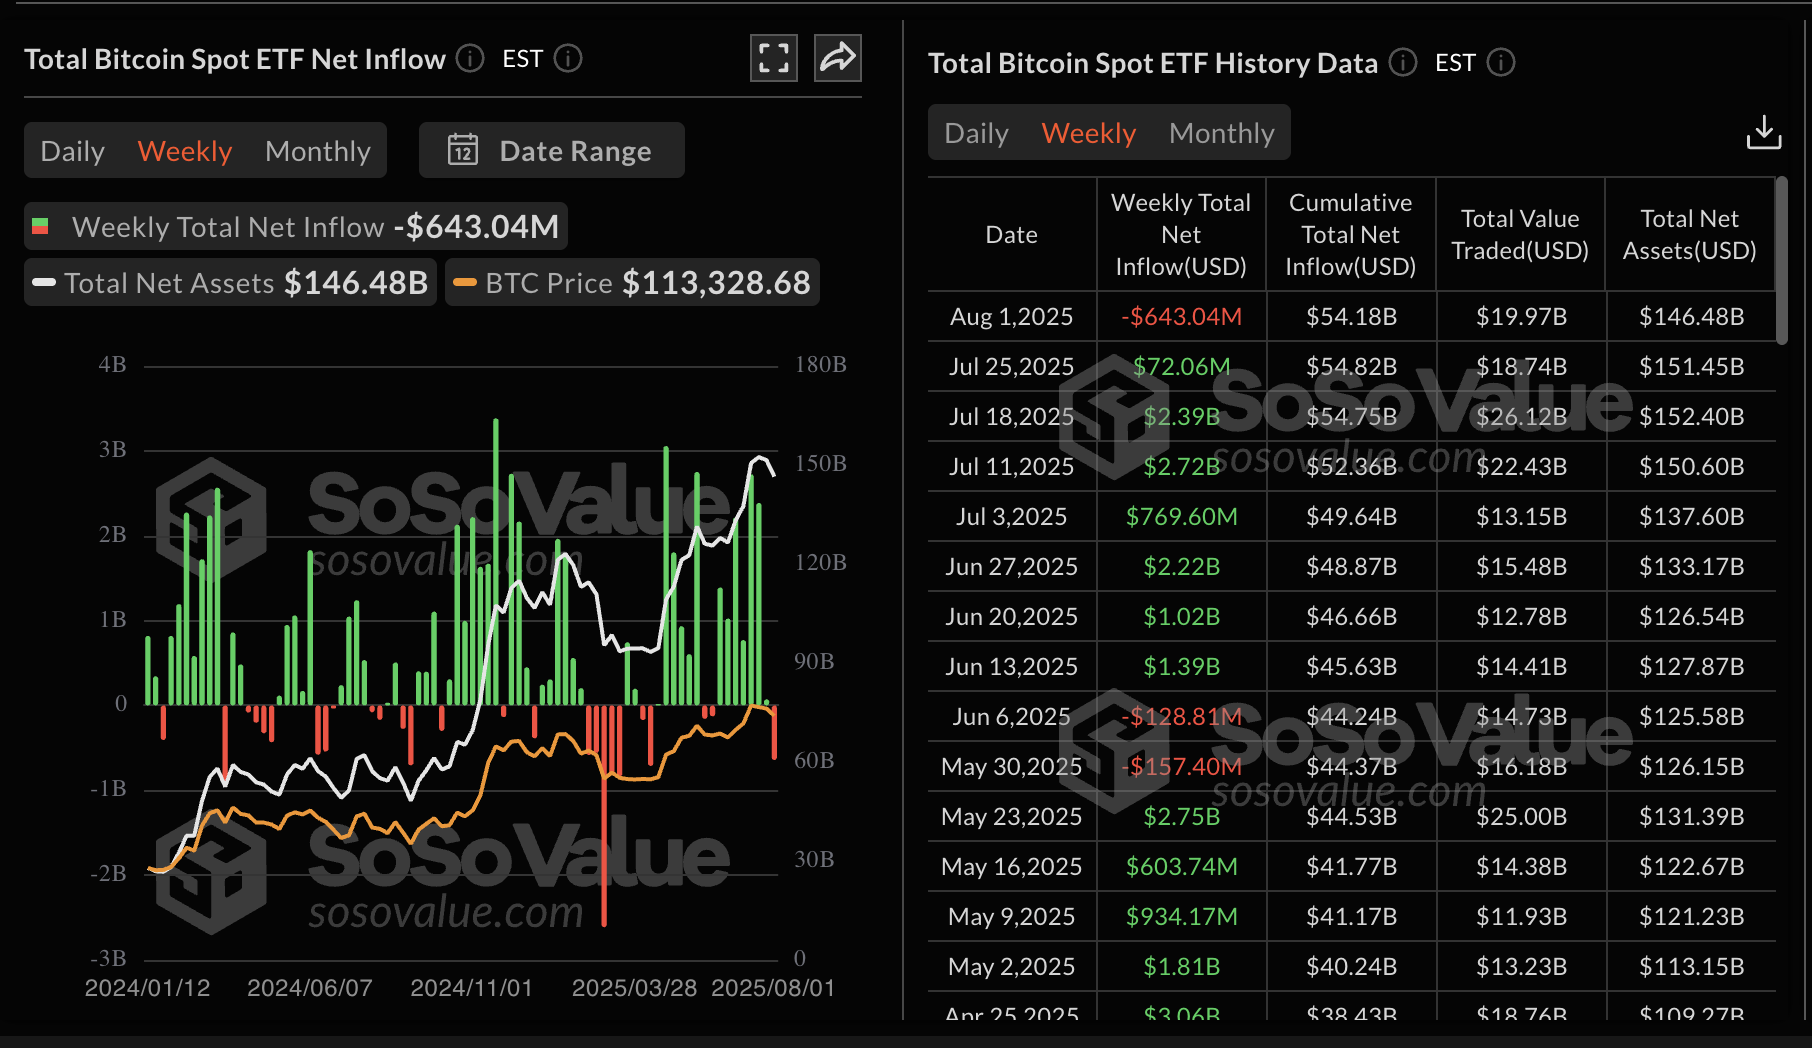
Bitcoin spot ETF data | Source: SoSoValue
Still, on-chain data from CryptoQuant shows that speculative demand remains positive as investors continue to accumulate BTC despite the recent price decline. Approximately, 160,000 BTC were purchased over the last 30 days, underpinning the demand for the largest cryptocurrency by market capitalization.
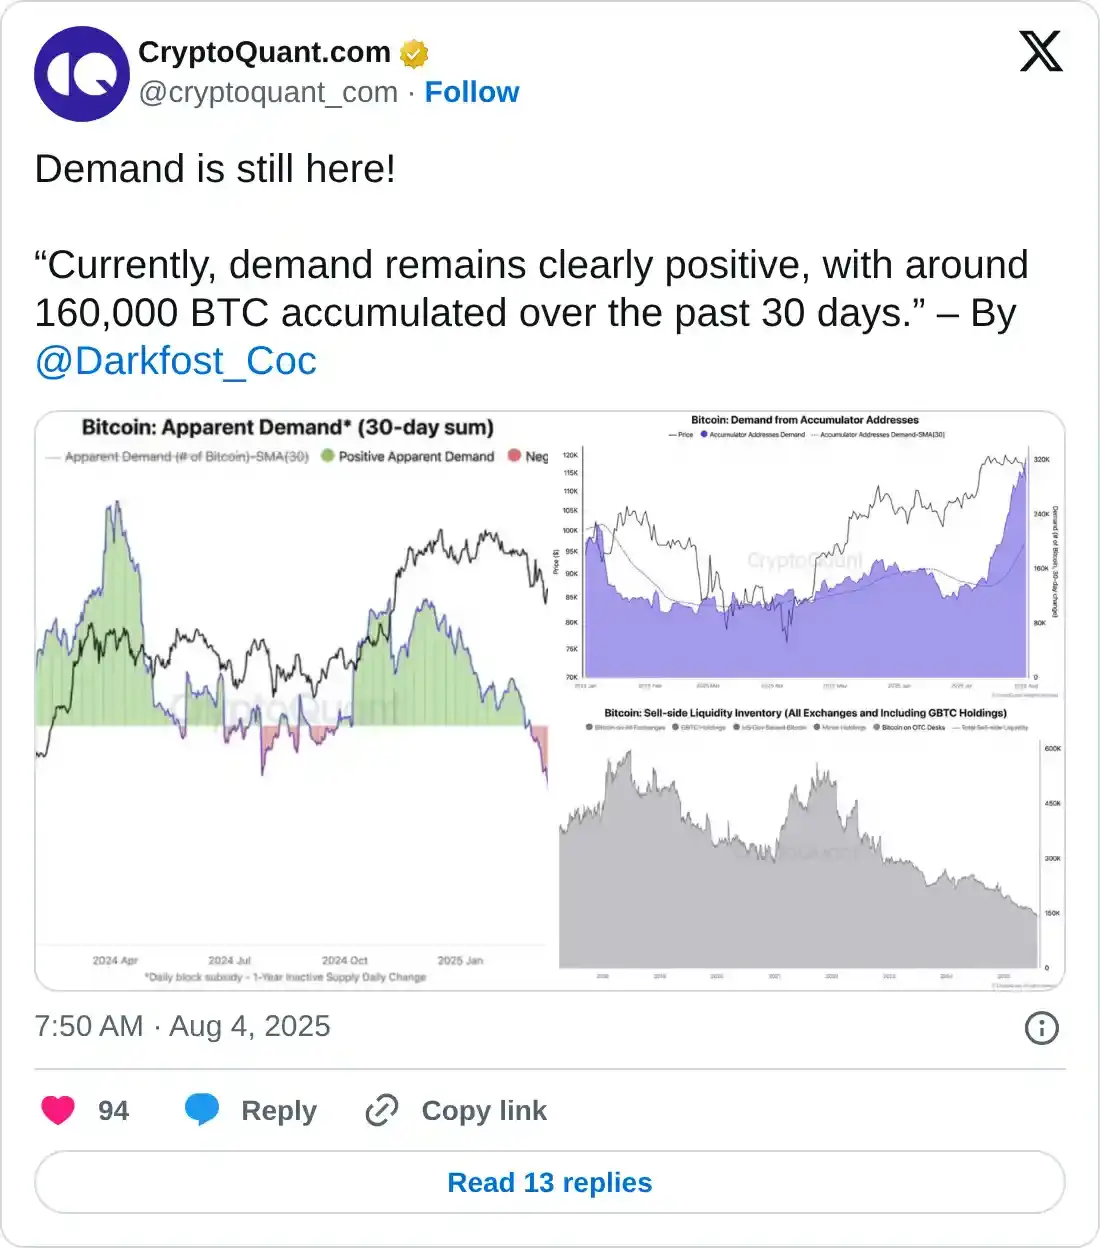
Chart of the day: Bitcoin edges higher
Bitcoin price has risen for two consecutive days after testing support at $111,886 on Saturday. Bulls appear focused on breaking the immediate $115,000 hurdle to pave the way for the second stage of the recovery toward $118,000 round-figure resistance zone.
Backing the trend reversal is the Relative Strength Index (RSI), which is approaching the midline after stabilizing at 40. If the RSI extends the recovery toward overbought territory, the path of least resistance will remain upward.
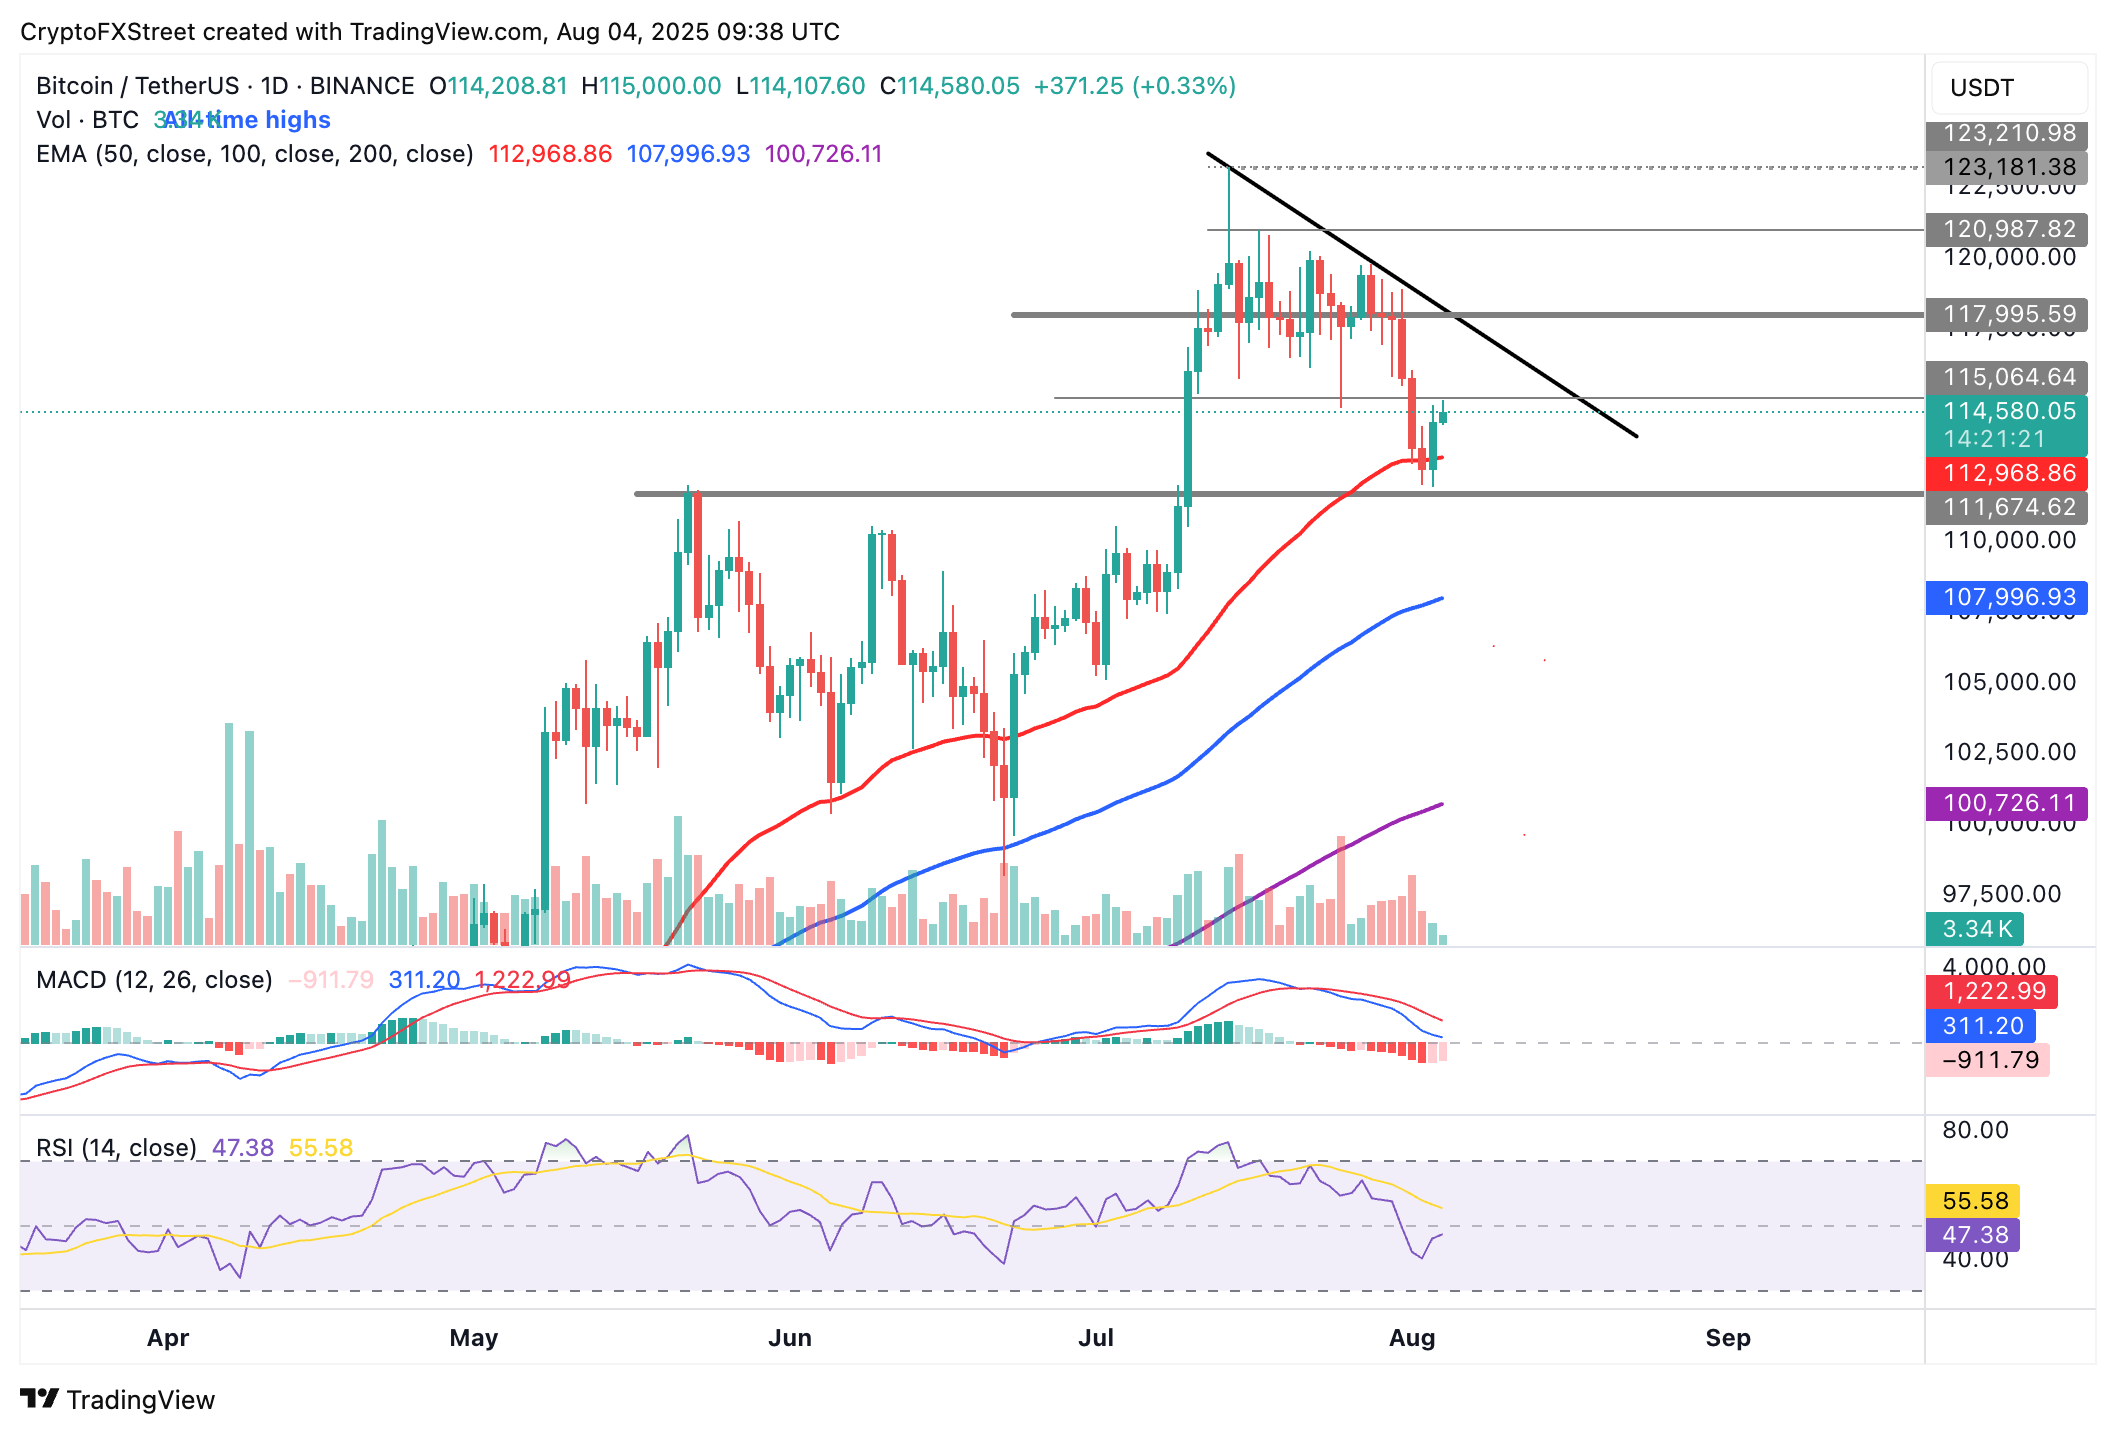
BTC/USDT daily chart
Despite the short-term bullish focus, investors should pay attention to tentative support levels. For instance, the 50-day Exponential Moving Average (EMA) at $112,968 and the 100-day EMA at $107,996 are key areas to watch in the event that last week’s downtrend resumes.
Altcoins update: Ethereum, XRP offer bullish signals
Ethereum price extends recovery for the second consecutive day, up around 6% from its last week’s low of $3,350. The token currently hovers above $3,549 as bulls aim for a swift move to the next key hurdle at $3,800.
The RSI and Moving Average Convergence Divergence (MACD) are key indicators to monitor, especially for intraday traders. Since the RSI has rebounded to 56 from the midline, speculative demand could bolster Ethereum price recovery in upcoming sessions.
As for the MACD, bears still have control, but selling pressure shows signs of easing. Traders should watch out for a buy signal if the blue MACD line crosses above the red signal line.
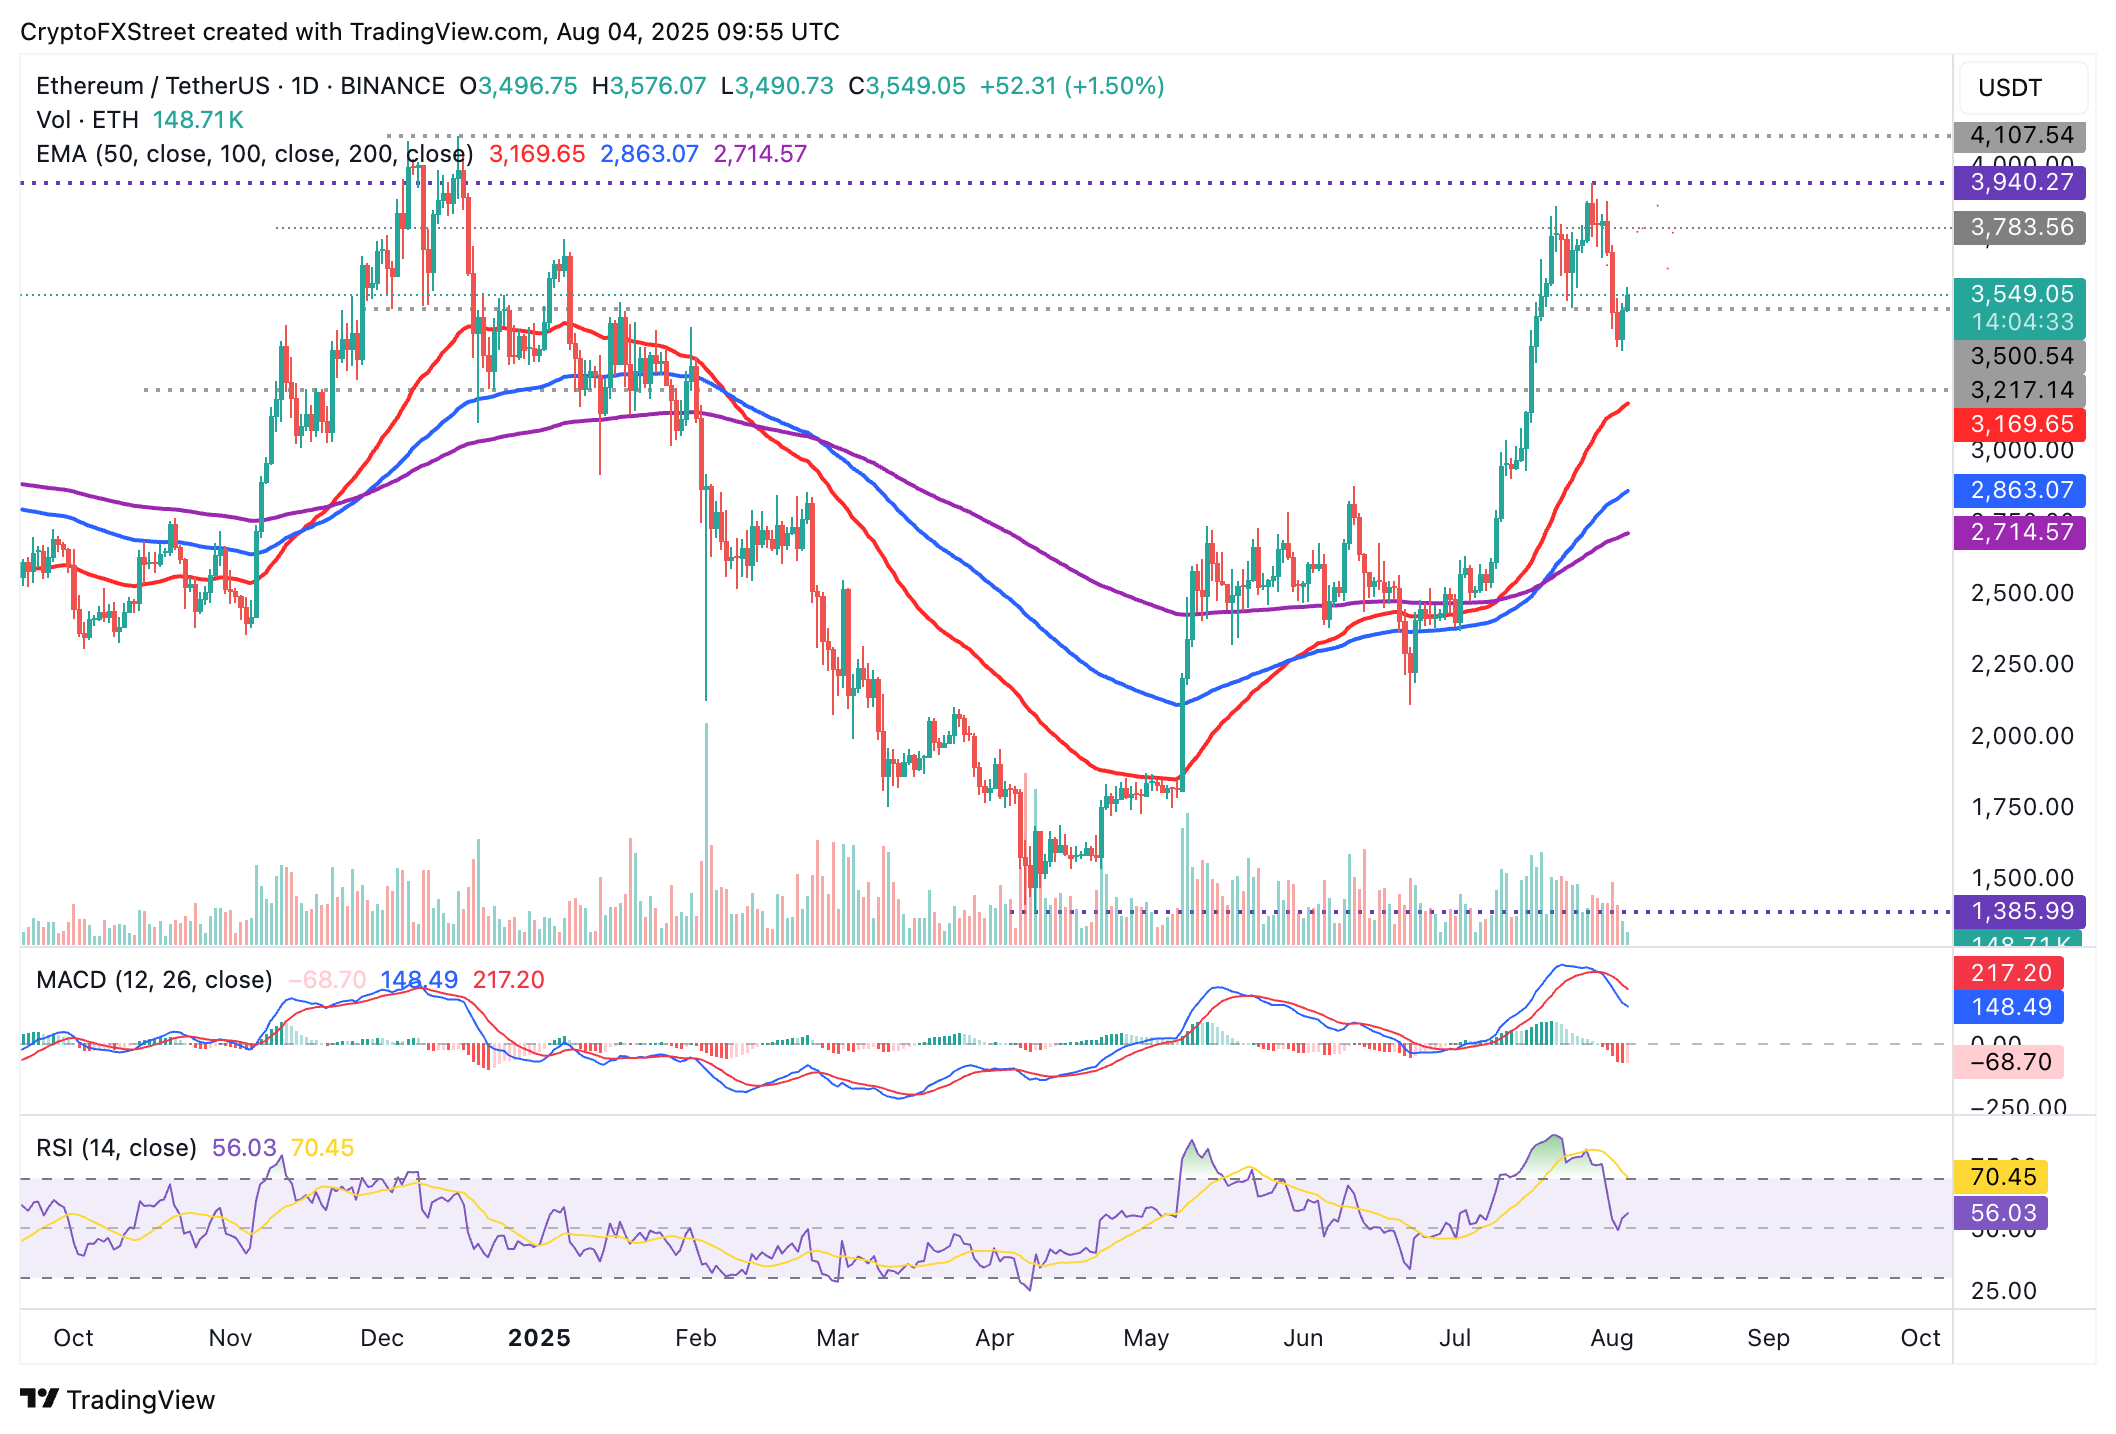
ETH/USDT daily chart
XRP, on the other hand, leans bullish, trading slightly above $3.00 on Monday. Institutional interest remains steady, evidenced by $31.3 million of inflows into related financial products explained above.
If retail interest returns, the cross-border money remittance token could extend the recovery to reach the $3.30 round-figure resistance and then later the record high of $3.66.
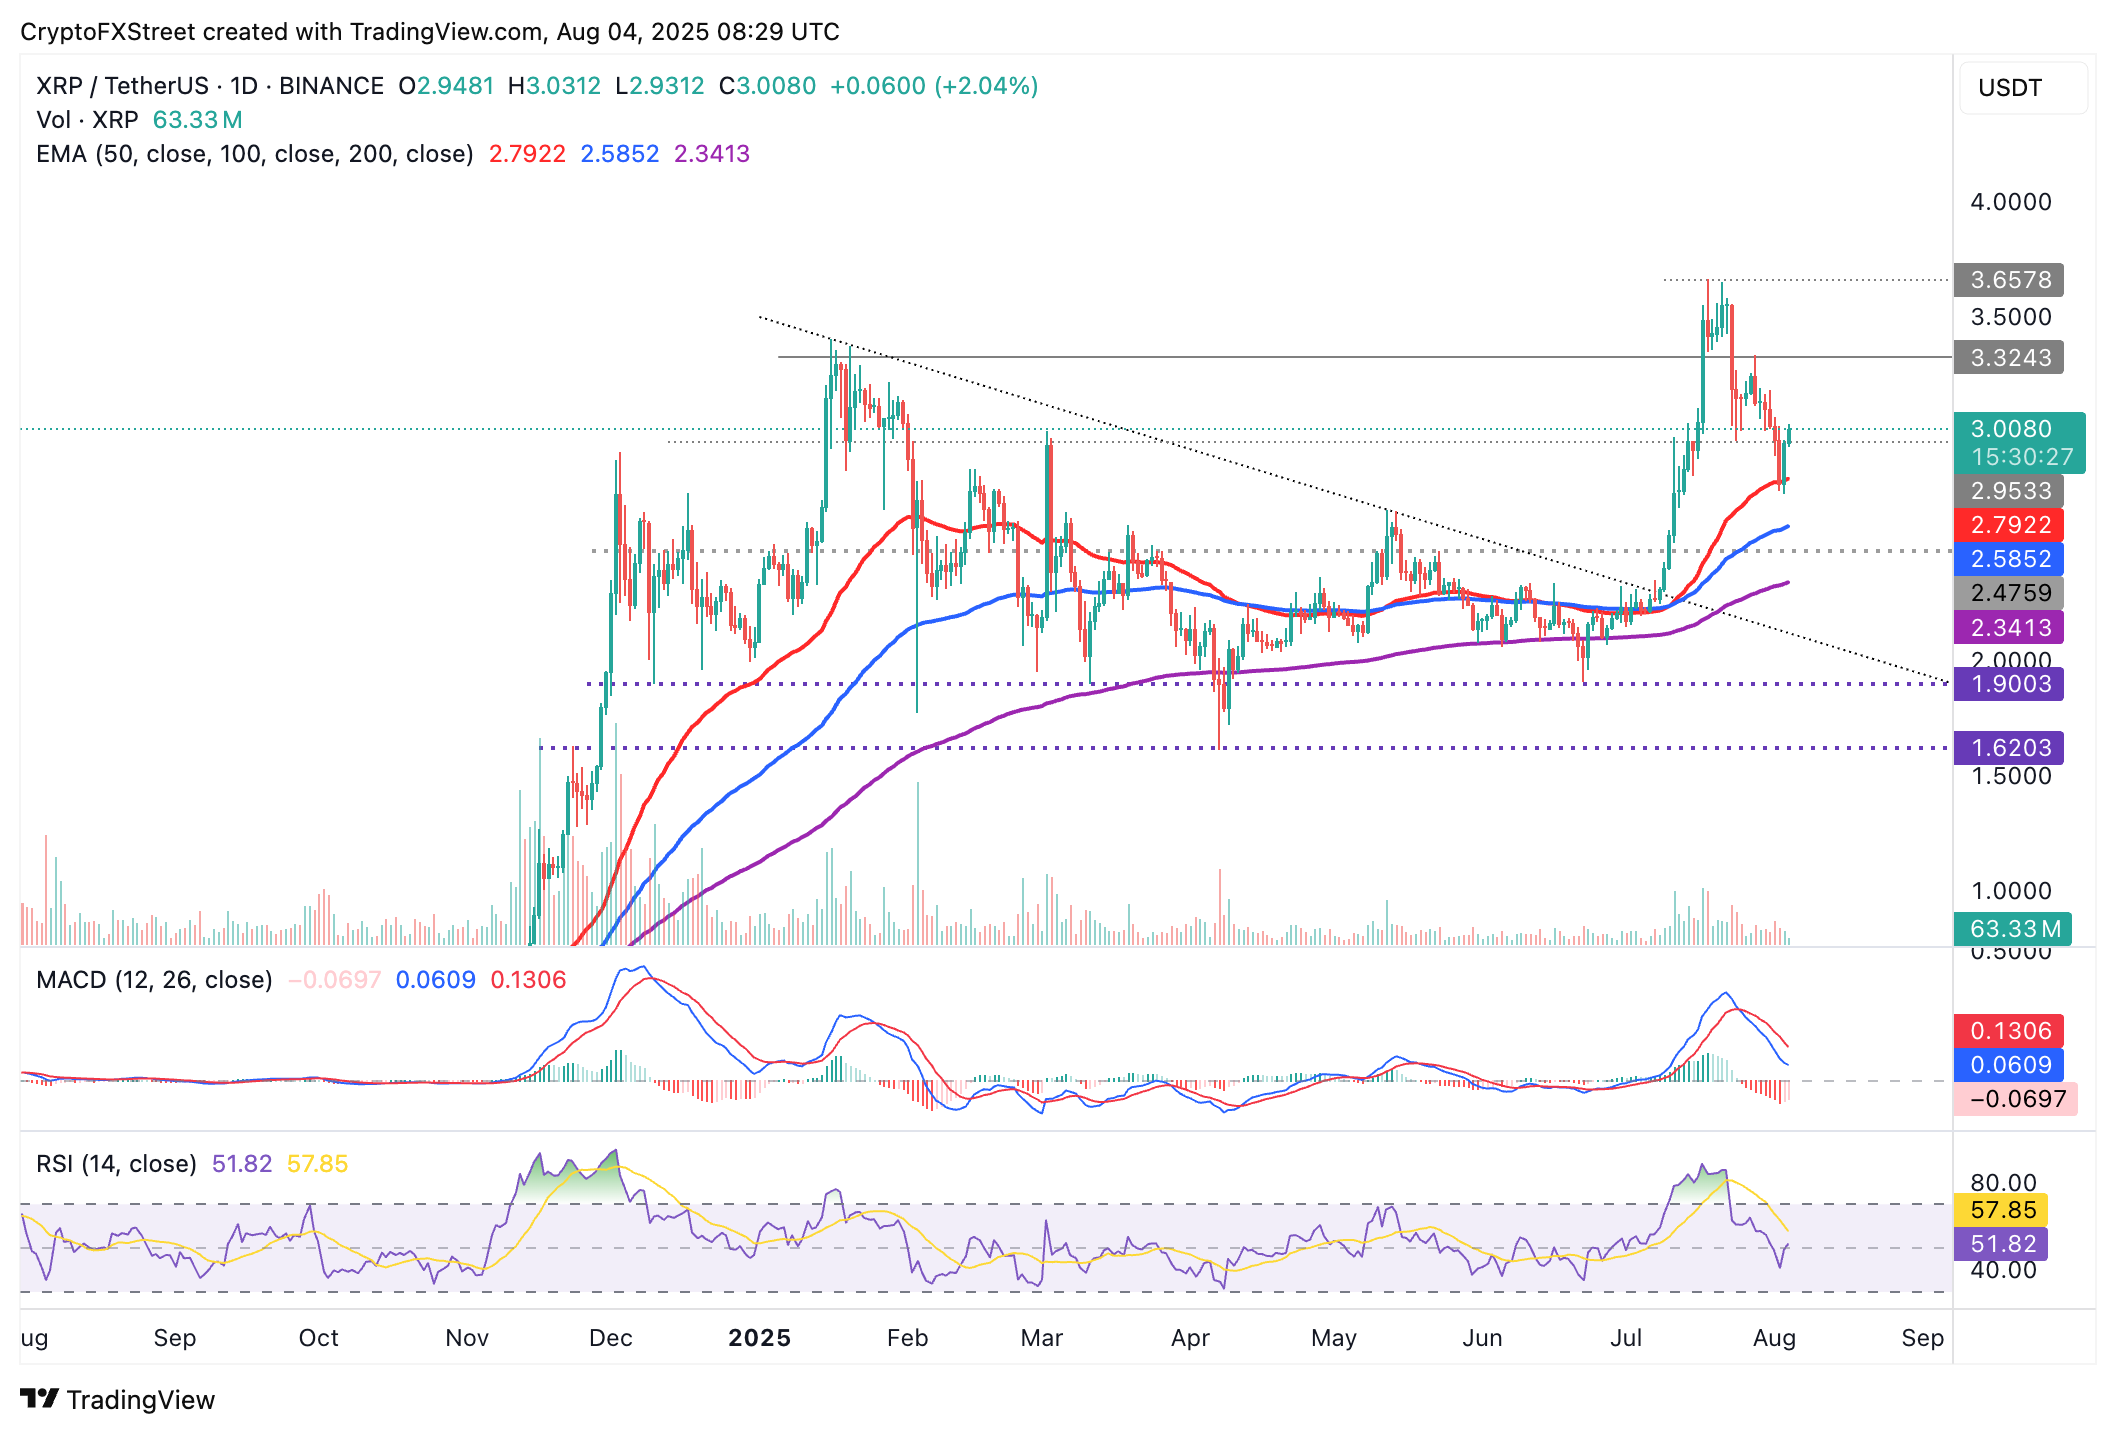
XRP/USDT daily chart
The RSI backs the recovery as it lifts slightly above the midline. Its continued movement toward overbought territory could steady speculative demand. Looking down, traders should not lose sight of tentative support levels, including the 50-day EMA at $2.79 and the 100-day EMA at $2.58.
Open Interest, funding rate FAQs
Higher Open Interest is associated with higher liquidity and new capital inflow to the market. This is considered the equivalent of increase in efficiency and the ongoing trend continues. When Open Interest decreases, it is considered a sign of liquidation in the market, investors are leaving and the overall demand for an asset is on a decline, fueling a bearish sentiment among investors.
Funding fees bridge the difference between spot prices and prices of futures contracts of an asset by increasing liquidation risks faced by traders. A consistently high and positive funding rate implies there is a bullish sentiment among market participants and there is an expectation of a price hike. A consistently negative funding rate for an asset implies a bearish sentiment, indicating that traders expect the cryptocurrency’s price to fall and a bearish trend reversal is likely to occur.
Author

John Isige
FXStreet
John Isige is a seasoned cryptocurrency journalist and markets analyst committed to delivering high-quality, actionable insights tailored to traders, investors, and crypto enthusiasts. He enjoys deep dives into emerging Web3 tren


