Crypto Today: Bitcoin, Ethereum, XRP slide further, test key supports
- Bitcoin extends the downtrend after a muted weekend, testing the 50-day EMA.
- Ethereum retraces lower within a falling channel, eyeing the $4,000 psychological level as the MACD flashes a sell signal.
- XRP drops below the $3.00 psychological support, risking a crucial support trendline breakdown.

Bitcoin (BTC) advances the pullback phase below the $115,000 level to test a crucial dynamic support, the 50-day Exponential Moving Average (EMA), at press time on Monday. The pullback spreads amid broader market fear, resulting in liquidations of over $500 million in the last 24 hours.
Similarly, Ethereum (ETH) and Ripple (XRP) are following the bearish trend, with nearly 4% losses. Amid the sell-off, institutional interest in top cryptocurrencies, such as Bitcoin and Ethereum, could face volatility moving forward.
The technical outlook for the main crypto assets suggests escalating downside risk as selling pressure intensifies.
Crypto market bleeds over $500 million within 24 hours
CoinGlass data indicate that the broader cryptocurrency liquidations totaled $552.42 million, comprising $483.23 million in long positions and $69.06 million in short positions.
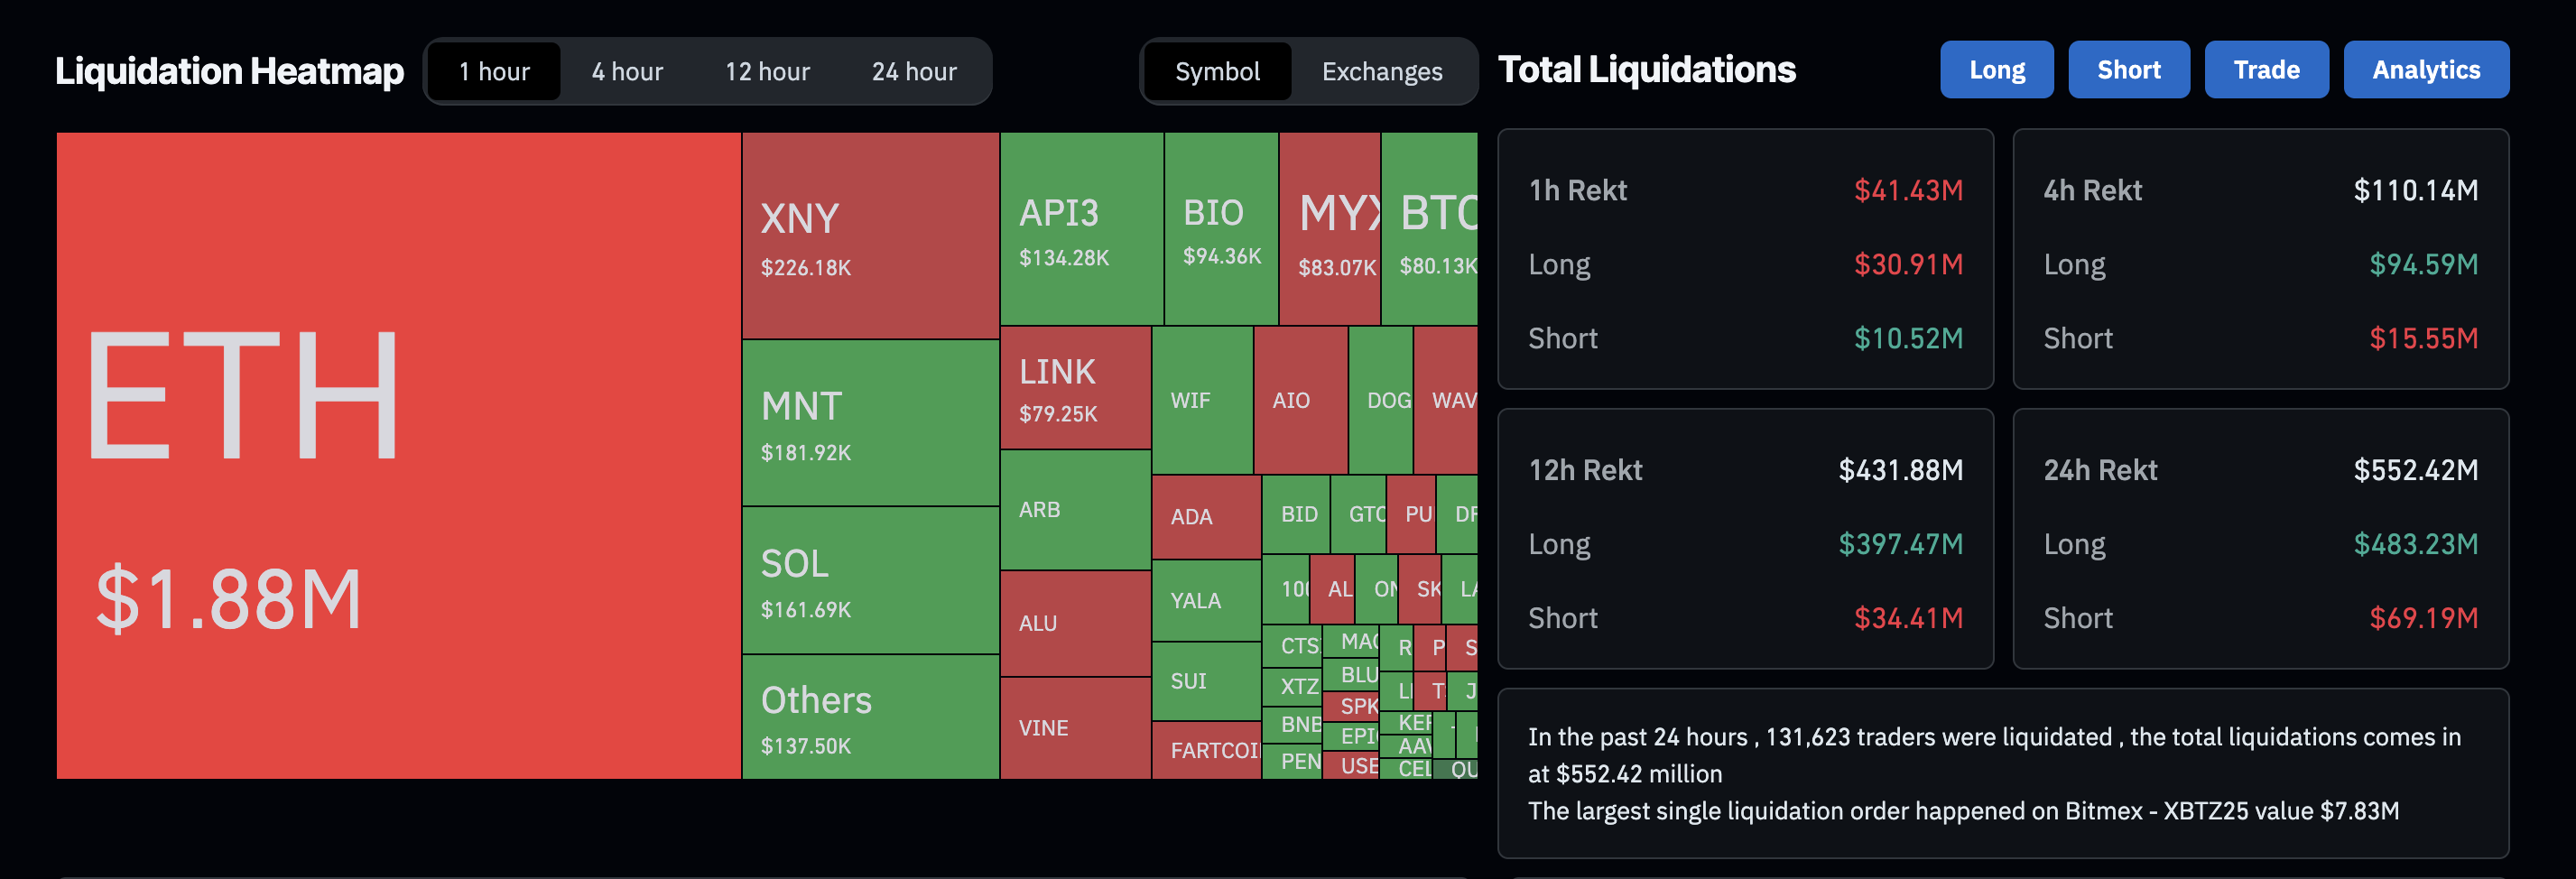
The clear imbalance of massive long liquidations suggests a shift to risk-off sentiment among investors. Amid such conditions, the crypto market could face further correction as fear tightens its grip.
Institutions uphold confidence in Bitcoin and Ethereum
Despite the pullback at the end of last week, Bitcoin and Ethereum were able to attract significant funds from US institutions. This marks an increase in confidence among institutional investors, which will be put to the test as Bitcoin and Ethereum experience steep declines this Monday.
Sosovalue data shows Ethereum marking its largest weekly net inflow of $2.85 billion, marking its fourteenth consecutive week of positive flows.
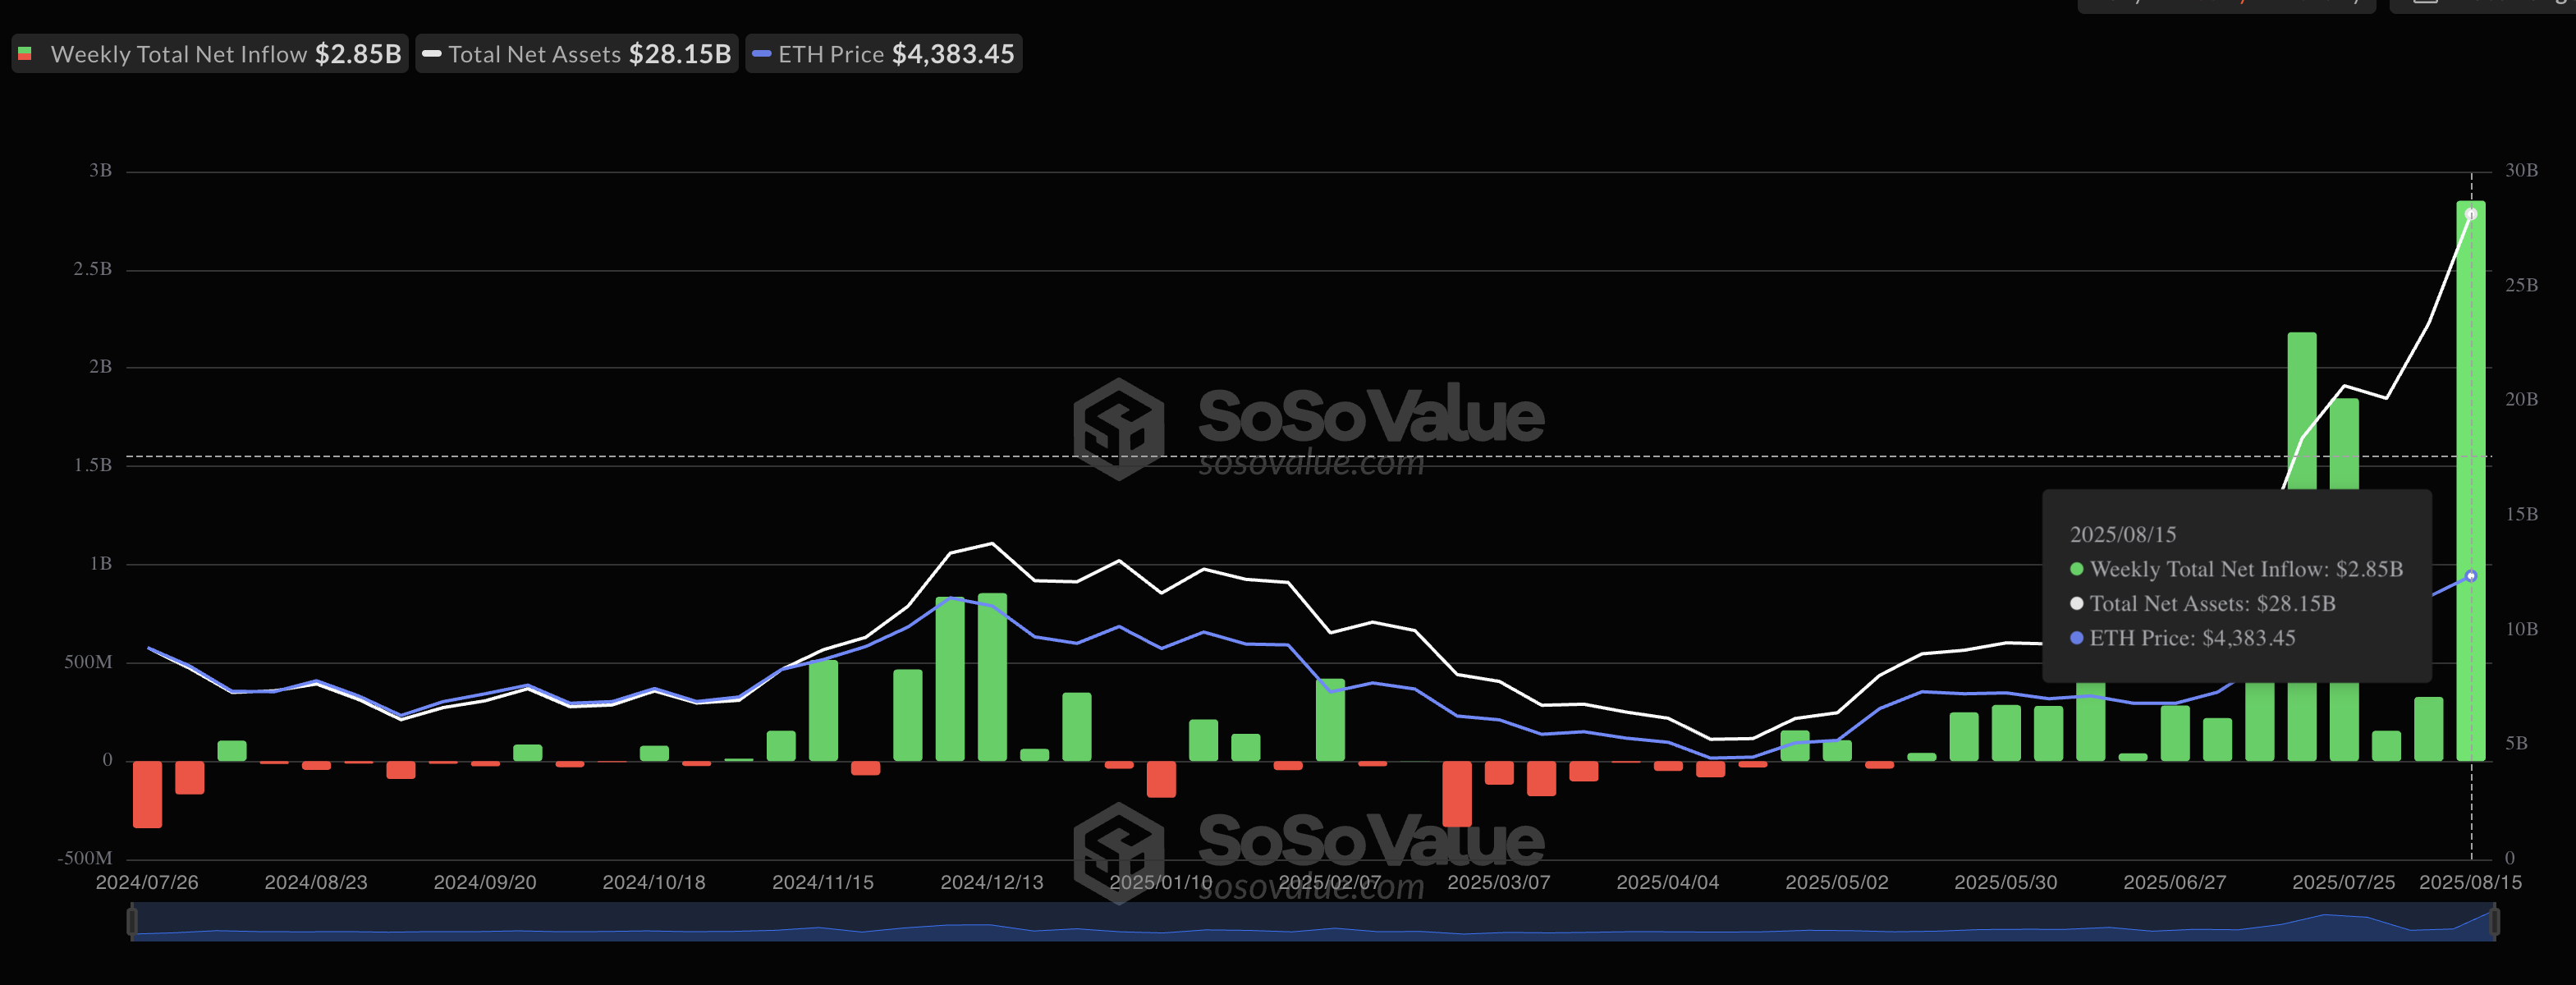
Ethereum spot ETF data | Source: SoSoValue
Bitcoin, on the other hand, maintained steady growth, with $547.82 billion in net inflows, surpassing the $246.75 billion in net inflows from the previous week.
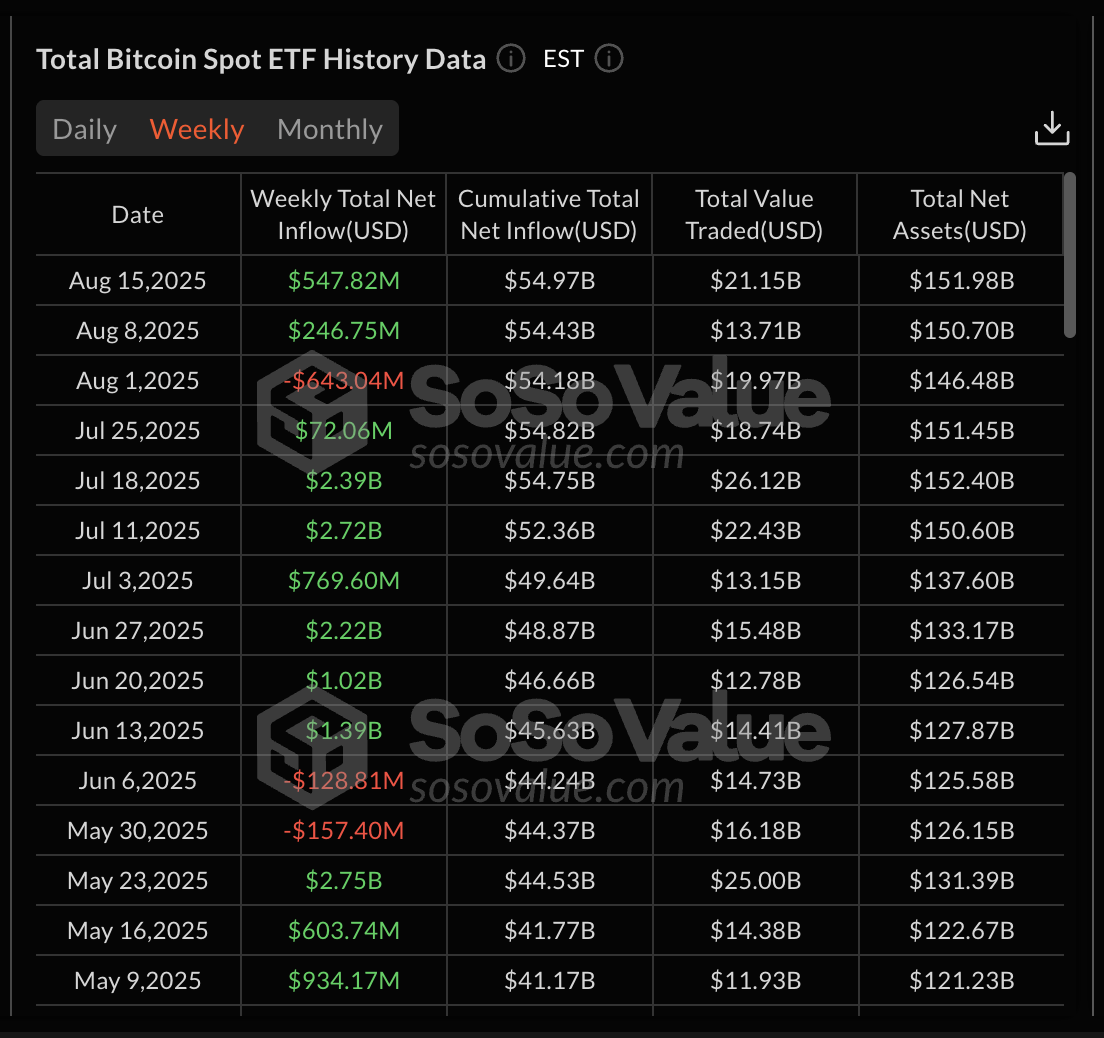
Bitcoin spot ETF data | Source: SoSoValue
The US-based Bitcoin and Ethereum ETFs hold total assets worth $151.98 billion and $28.15 billion, respectively.
Bitcoin loses strength, bears target $111,980
Bitcoin ticks lower by 2% at press time on Monday, crossing under the 50-day EMA at $115,001. Bitcoin’s bullish run from last week's peak at $124,474 on Thursday, resulting in a 4% drop on the day, ignited the ongoing pullback.
The path of least resistance targets the $111,980 support level, last tested on August 3, as pressure on Bitcoin intensifies.
The momentum indicators flash a sell signal as bullish momentum fades. On the daily chart, the Moving Average Convergence Divergence (MACD) crosses below its signal line. Additionally, the Relative Strength Index (RSI) is at 44, below the halfway line, indicating a decline in buying pressure.
The 100-day and 200-day EMAs at $110,362 and $102,939, respectively, could act as dynamic support levels if the downtrend continues.
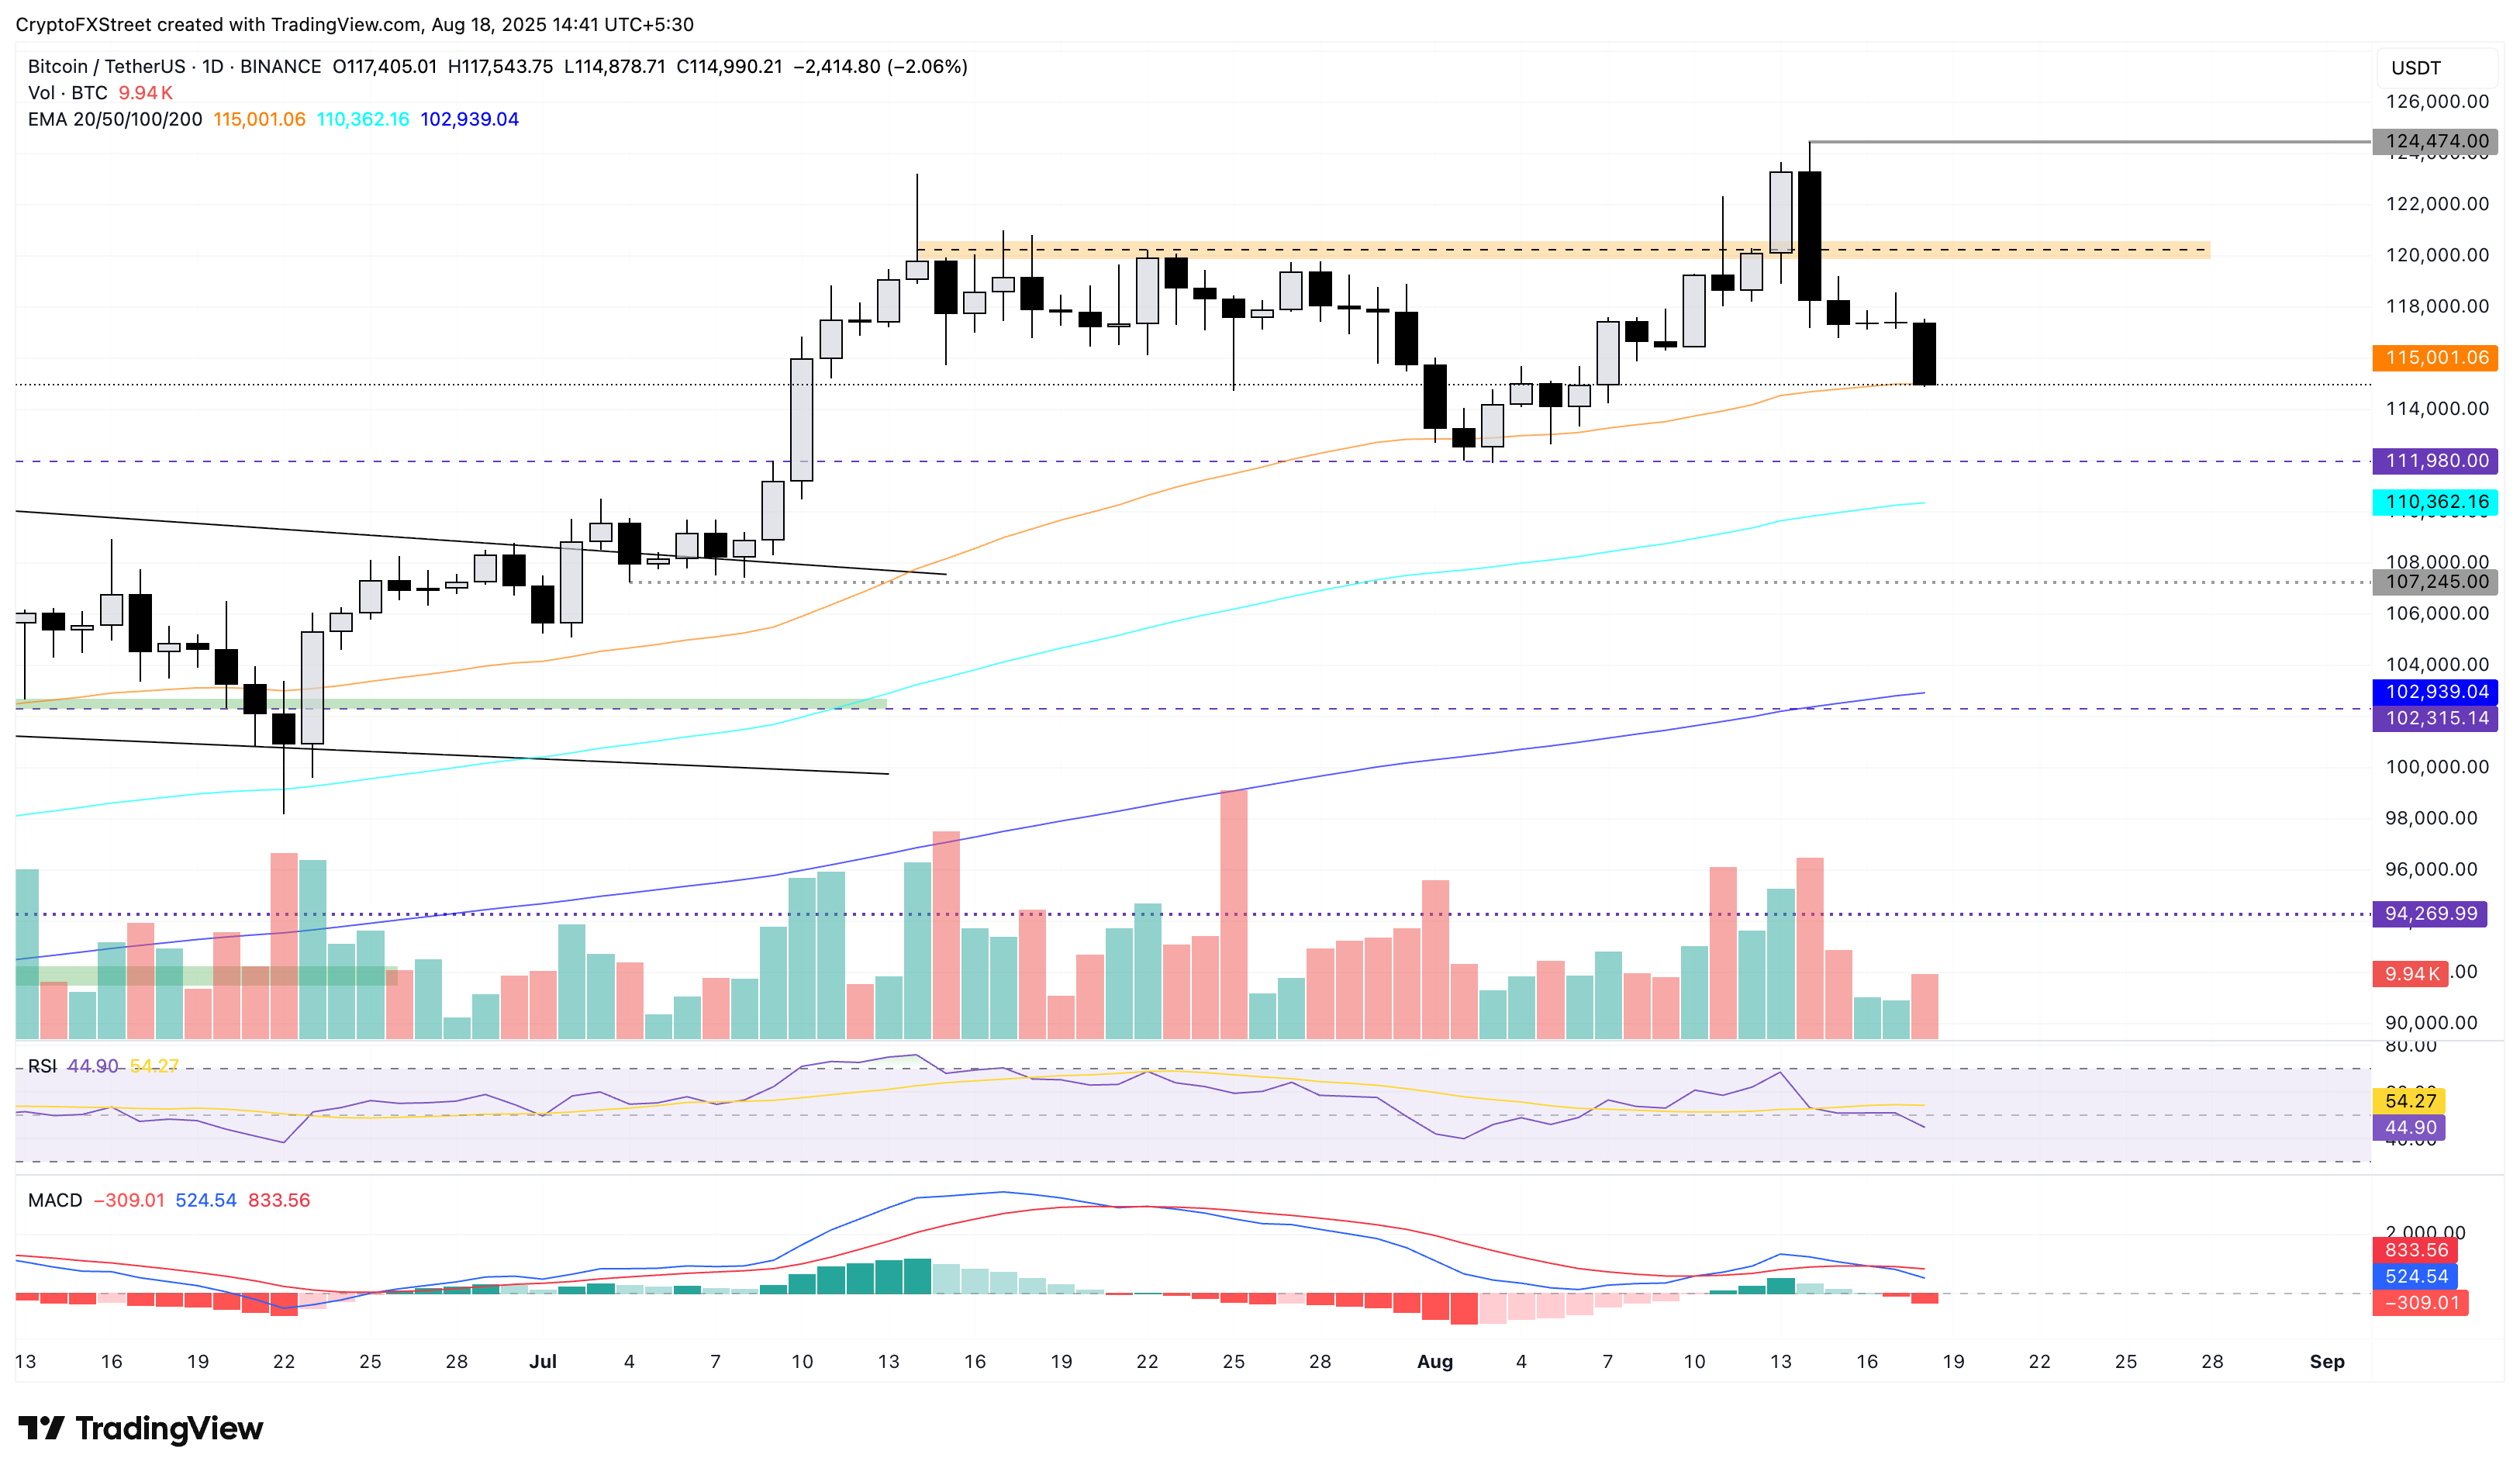
BTC/USDT daily price chart.
Looking up, a bounce back from the 50-day EMA at $115,001 could target the $120,000 supply zone.
Ethereum declines within a channel, targeting $4,000
Ethereum bulls fail to hold over $4,300 as the altcoin depreciates by over 4% at the time of writing on Monday. The altcoin falls towards the support trendline of a rising channel on the daily chart (shared below) after reversing from the previous week’s high at $4,868.
Amid the sell-off, ETH targets the $3,941 level, marked by the high of July 28, which coincides with the lower boundary of the rising channel.
The MACD approaches its signal line, hinting at a potential trend reversal, as declining green histograms suggest that bullish momentum is fading. Additionally, the RSI reads 58 on the daily chart, dropping below the overbought zone and indicating a sharp decline in buying pressure.
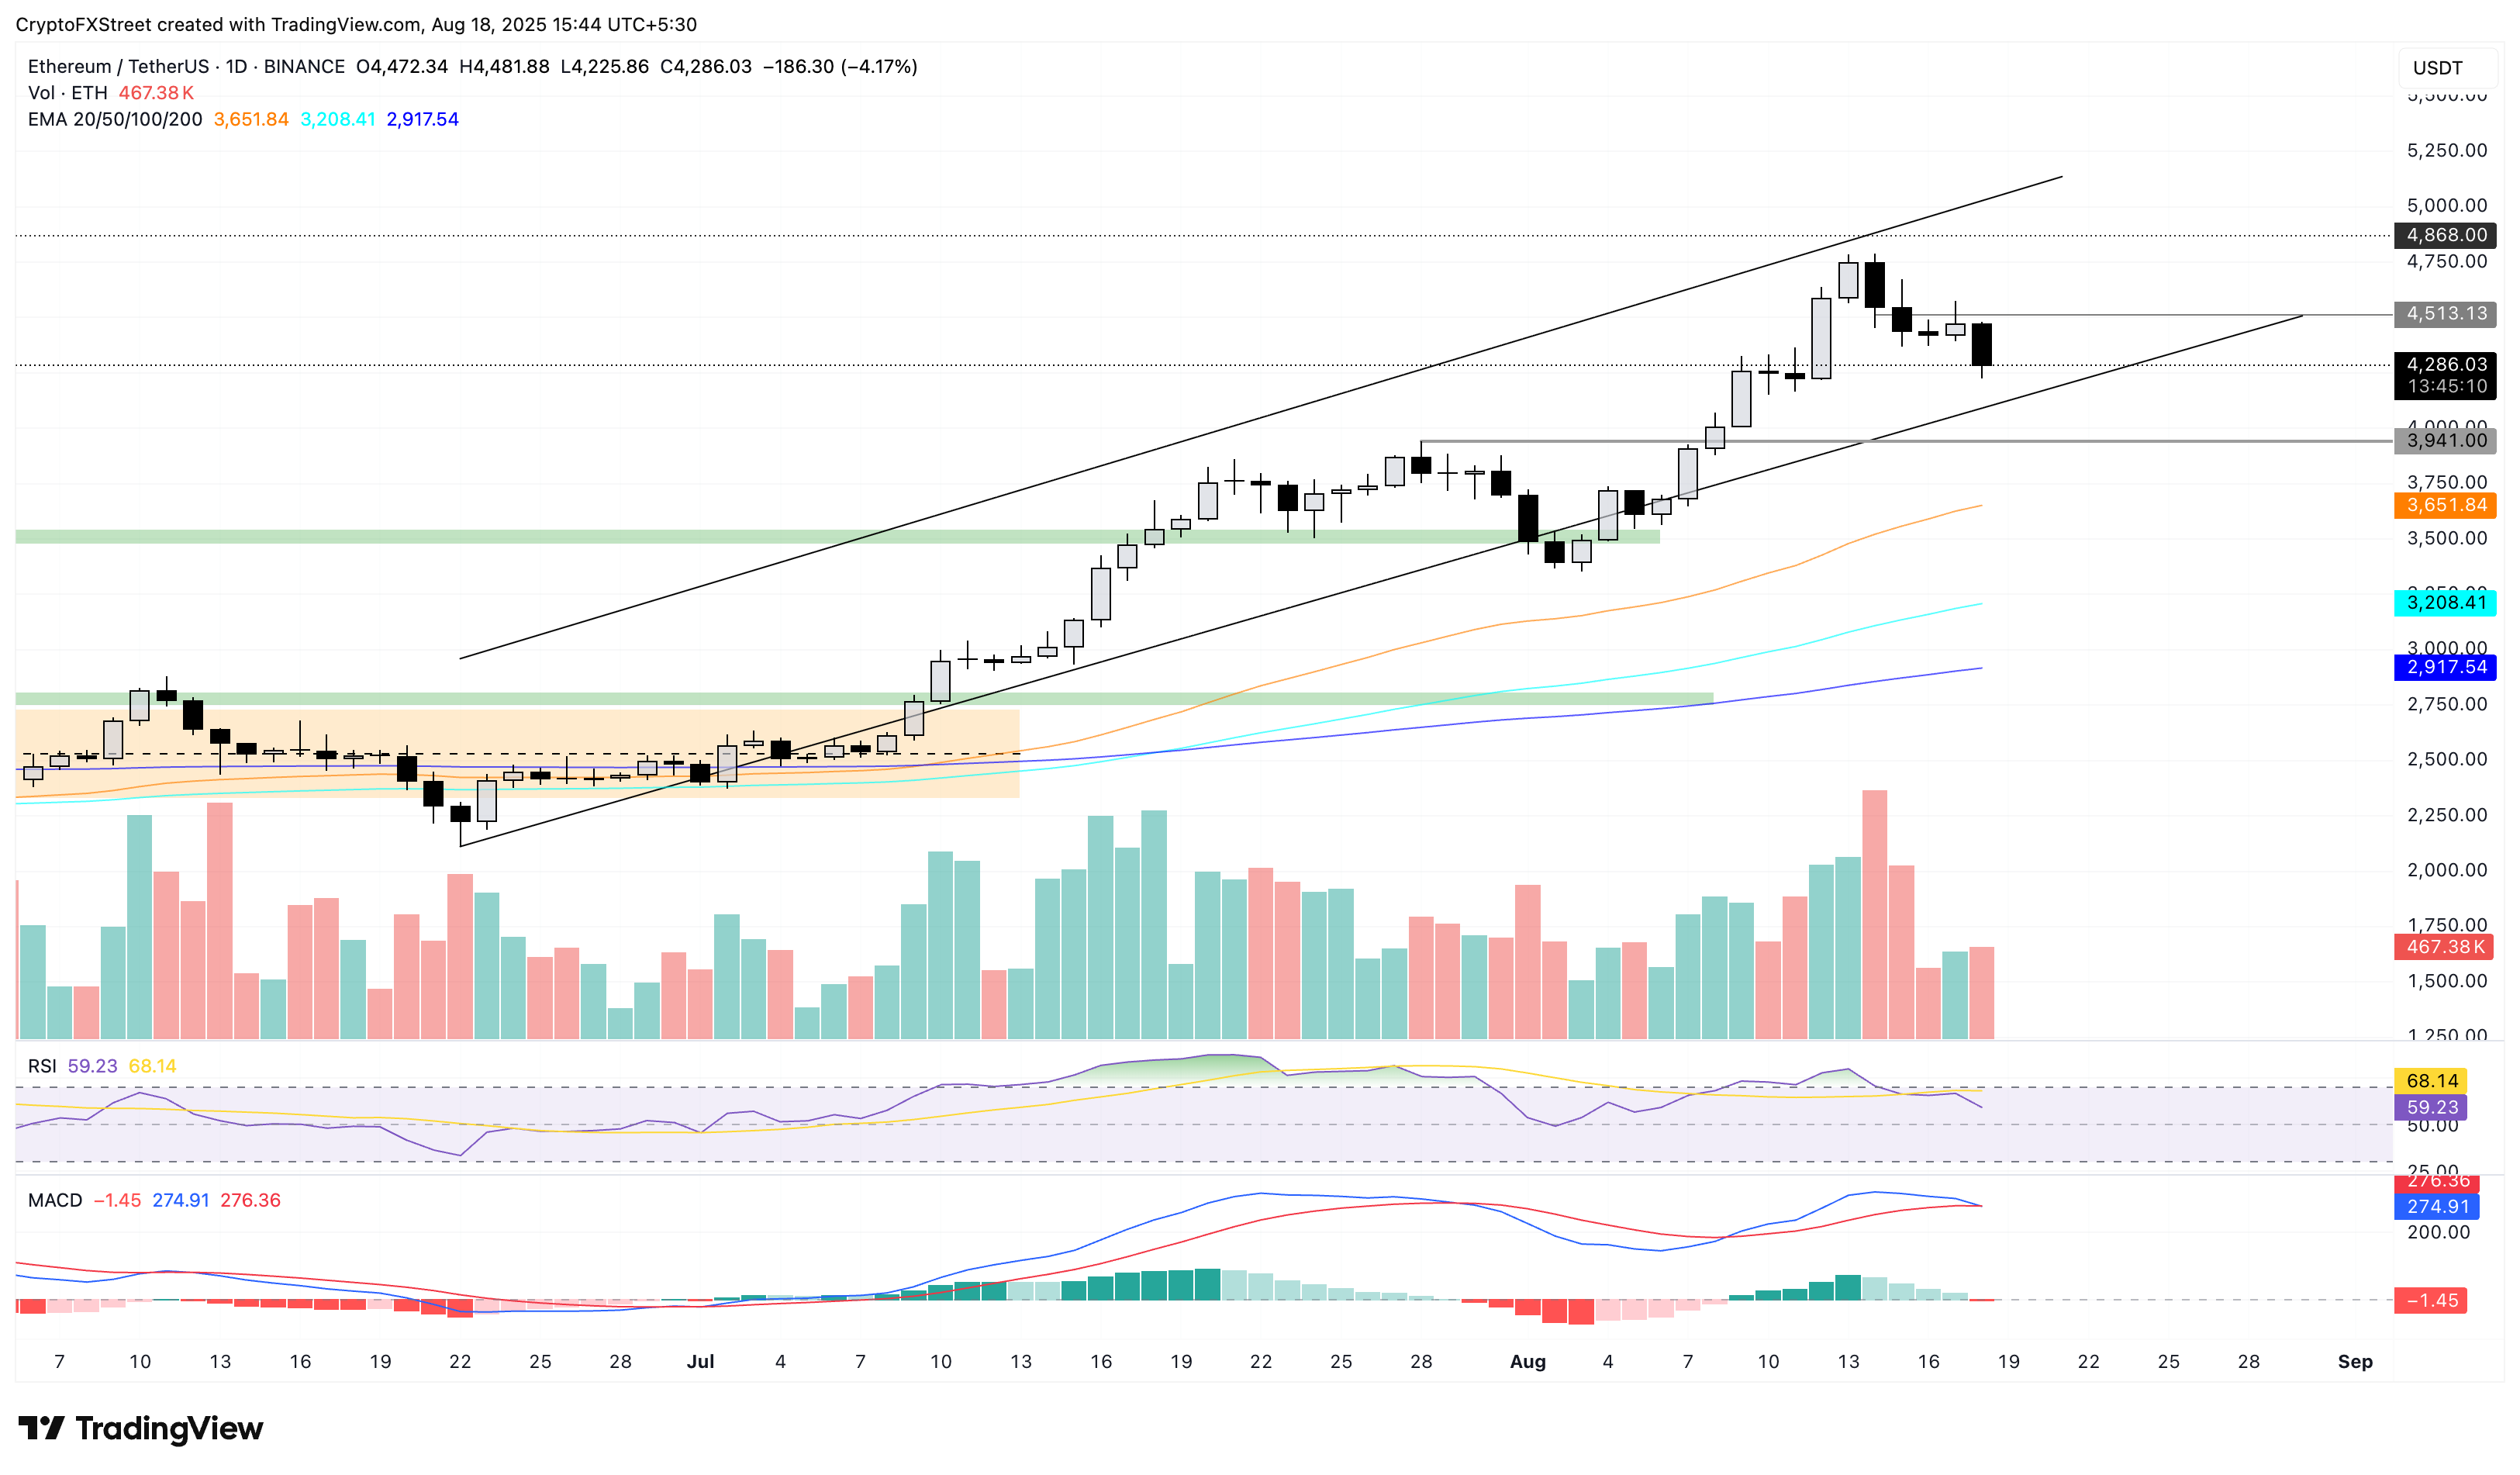
ETH/USDT daily price chart.
On the other hand, an intraday reversal securing a positive close for the day could test the $4,500 psychological resistance.
XRP’s trendline breakdown risks further losses
Ripple drops below the $3.00 mark, trading at $2.97 at press time on Monday with a loss of 3.8%. XRP’s pullback puts a long-standing resistance trendline formed by connecting the June 23 and August 3 lows, and the 50-day EMA at $2.94 to test.
The cross-border remittance token also tests the 38.2% Fibonacci level at $2.99, which is drawn from the low of $1.90 on June 22 to the high of $3.66 on July 18. A decisive close below the 50-day EMA could test the 50% retracement level $2.78.
The momentum indicators hold a bearish bias as the RSI at 45 leans below the halfway line, indicating a tired-out buying pressure. Additionally, the MACD and its signal extend the declining trend, pointing to increased bearish momentum.
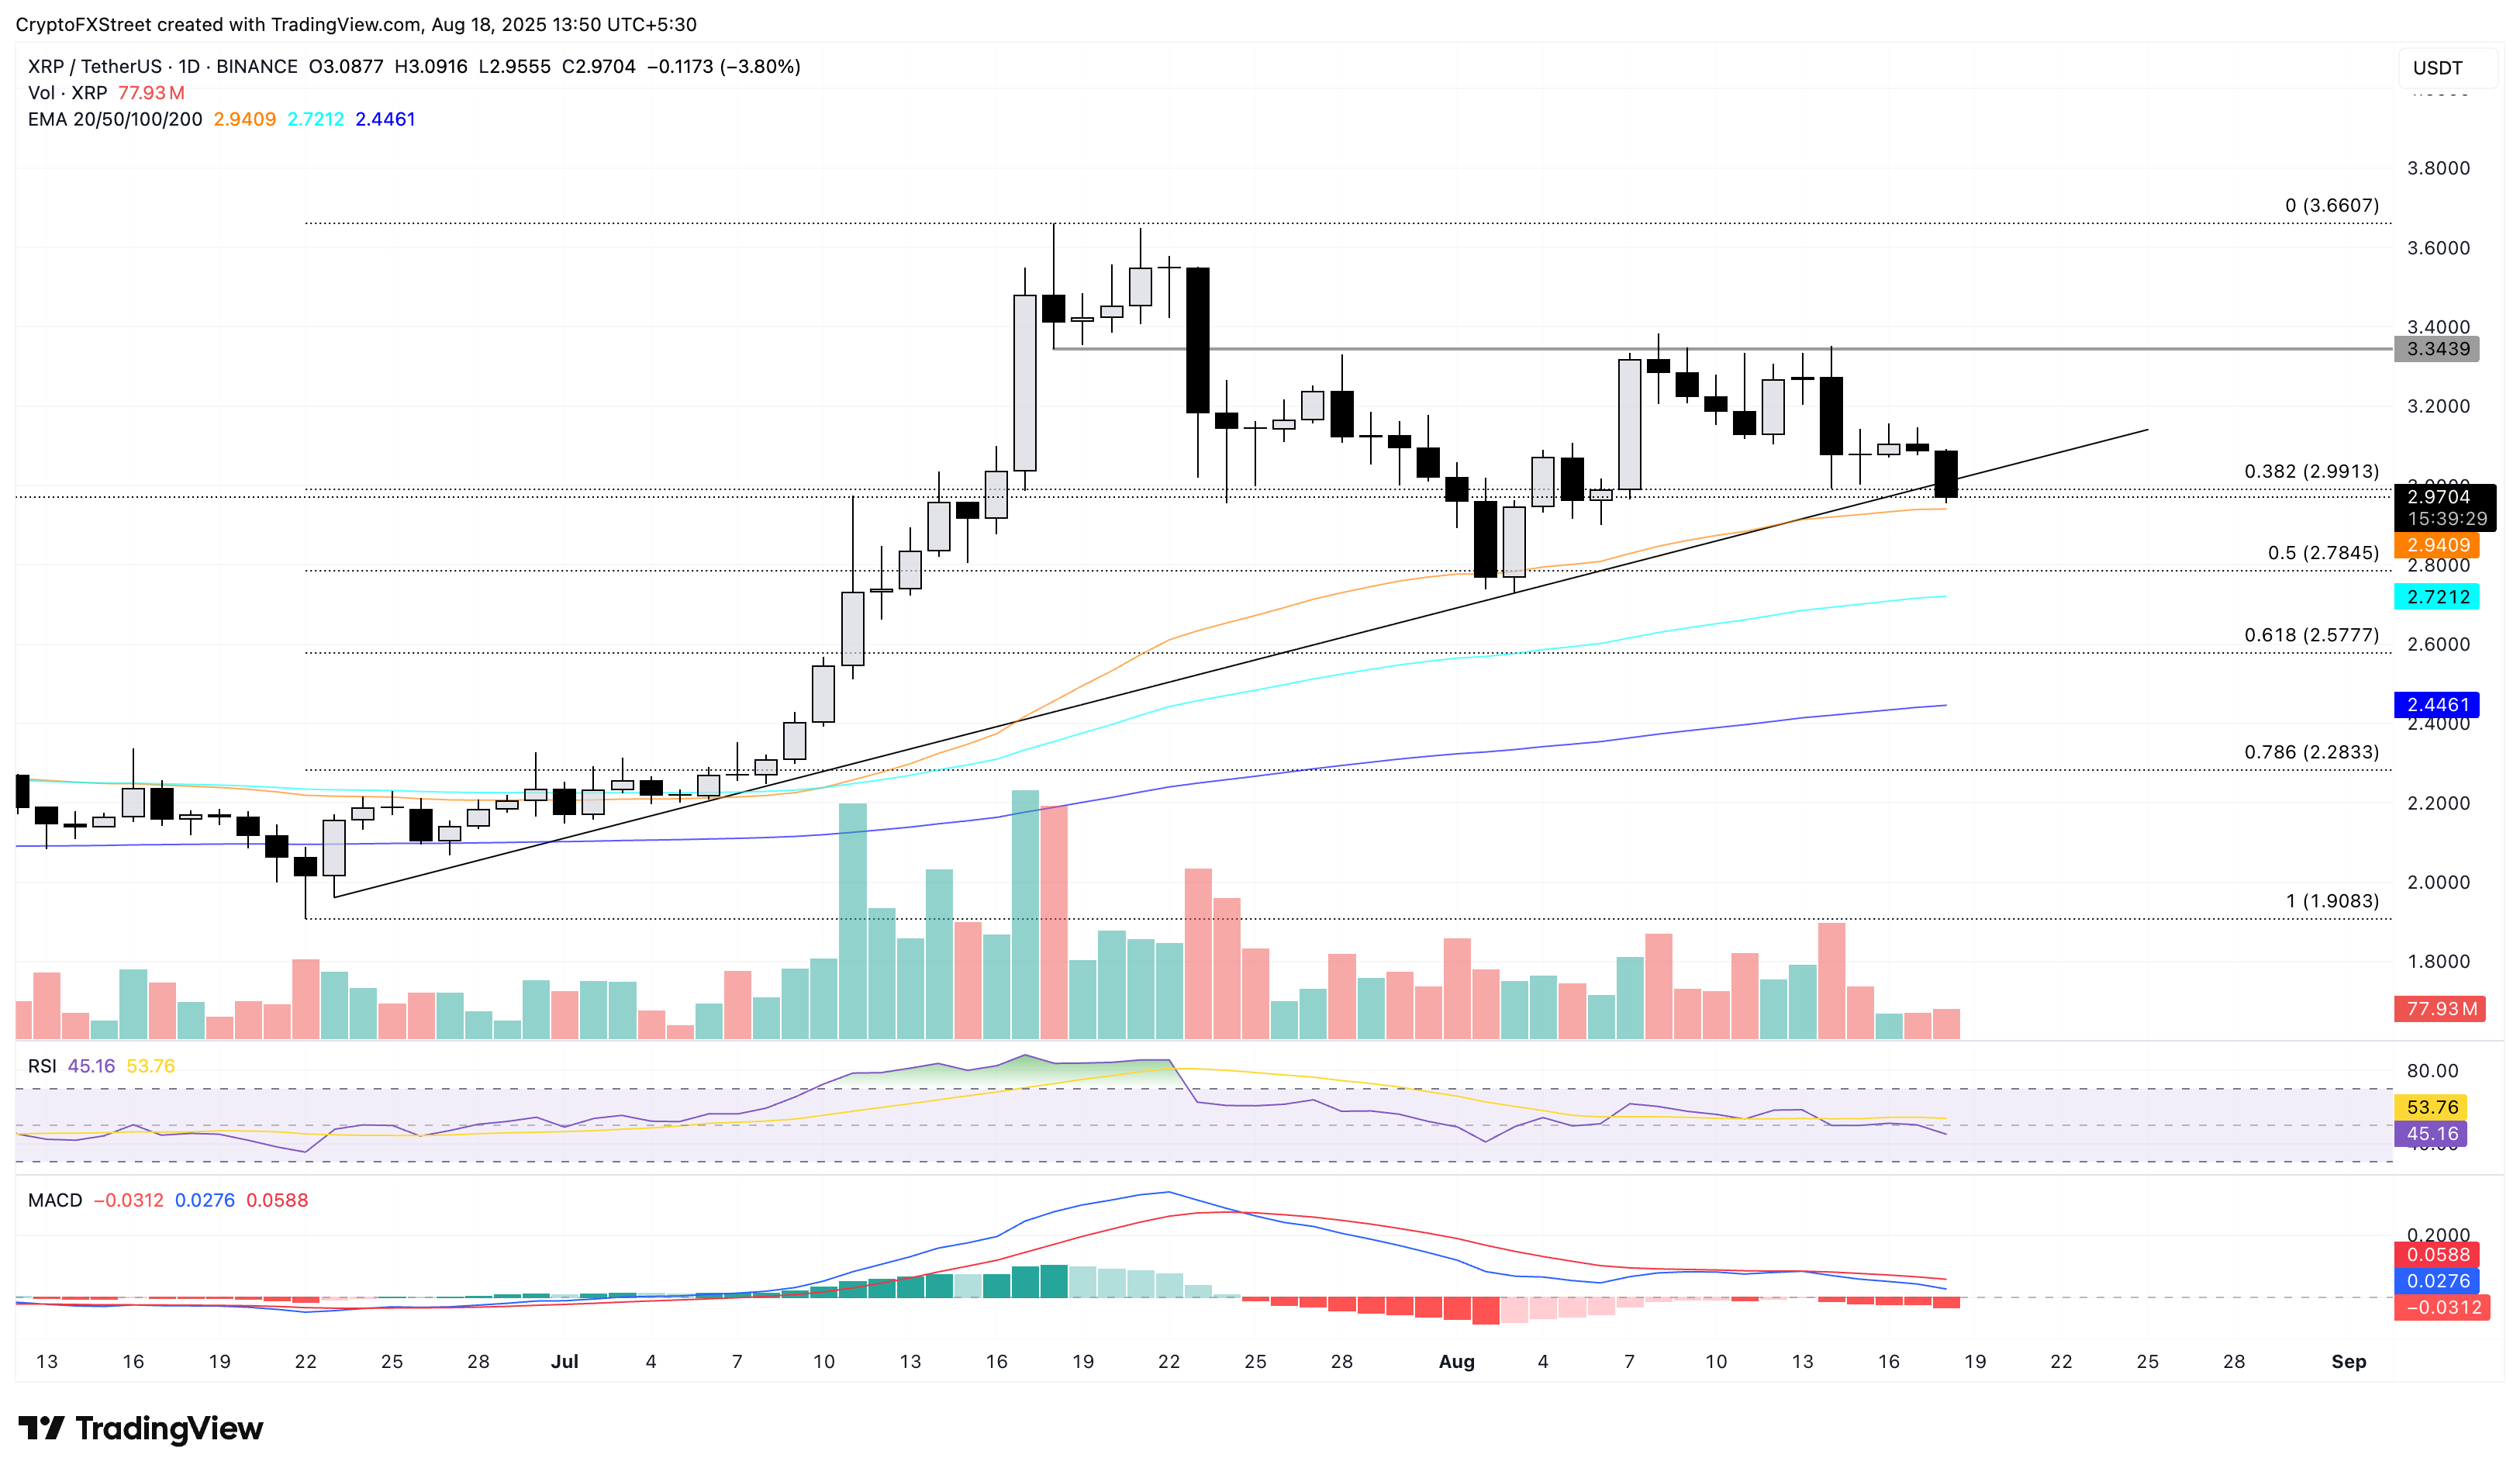
XRP/USDT daily price chart.
On the flip side, if XRP holds above the support trendline at $3.00, a bounce back could retest the $3.34 resistance, last tested on Thursday.
Open Interest, funding rate FAQs
Higher Open Interest is associated with higher liquidity and new capital inflow to the market. This is considered the equivalent of increase in efficiency and the ongoing trend continues. When Open Interest decreases, it is considered a sign of liquidation in the market, investors are leaving and the overall demand for an asset is on a decline, fueling a bearish sentiment among investors.
Funding fees bridge the difference between spot prices and prices of futures contracts of an asset by increasing liquidation risks faced by traders. A consistently high and positive funding rate implies there is a bullish sentiment among market participants and there is an expectation of a price hike. A consistently negative funding rate for an asset implies a bearish sentiment, indicating that traders expect the cryptocurrency’s price to fall and a bearish trend reversal is likely to occur.
Author

Vishal Dixit
FXStreet
Vishal Dixit holds a B.Sc. in Chemistry from Wilson College but found his true calling in the world of crypto.


