Crypto Today: Bitcoin, Ethereum, XRP recovery stalls, as BTC spot ETF inflows approach $50 billion
- Bitcoin consolidates after a minor correction, exhibiting a slight bearish bias amid steady spot ETF inflows.
- Ethereum broadly consolidates, with recovery to $3,000 elusive, reflecting subdued market sentiment.
- Ripple's expansion of stablecoin infrastructure and institutional-grade products fails to boost XRP price as it drops to test the 100-day EMA.

A bearish wave sweeps through the cryptocurrency market on Friday, triggering widespread declines across the sector. Bitcoin (BTC) extends its pullback from Thursday's highs of $110,530, trading at around $108,964 at the time of writing. Leading altcoins Ethereum (ETH) and Ripple (XRP) reflect the lethargic market sentiment, clawing back some of the gains accrued this week.
Market overview: Institutions bolster Bitcoin near all-time highs
Corporate interest in Bitcoin remains steady as listed companies seek exposure through strategic crypto treasuries. According to SoSOValue data, Bitcoin treasuries saw a $863 million weekly net inflow as of June 30. This cohort of investors holds approximately 664,000 BTC valued at around $72 billion, accounting for 3.3% of the total circulating supply.
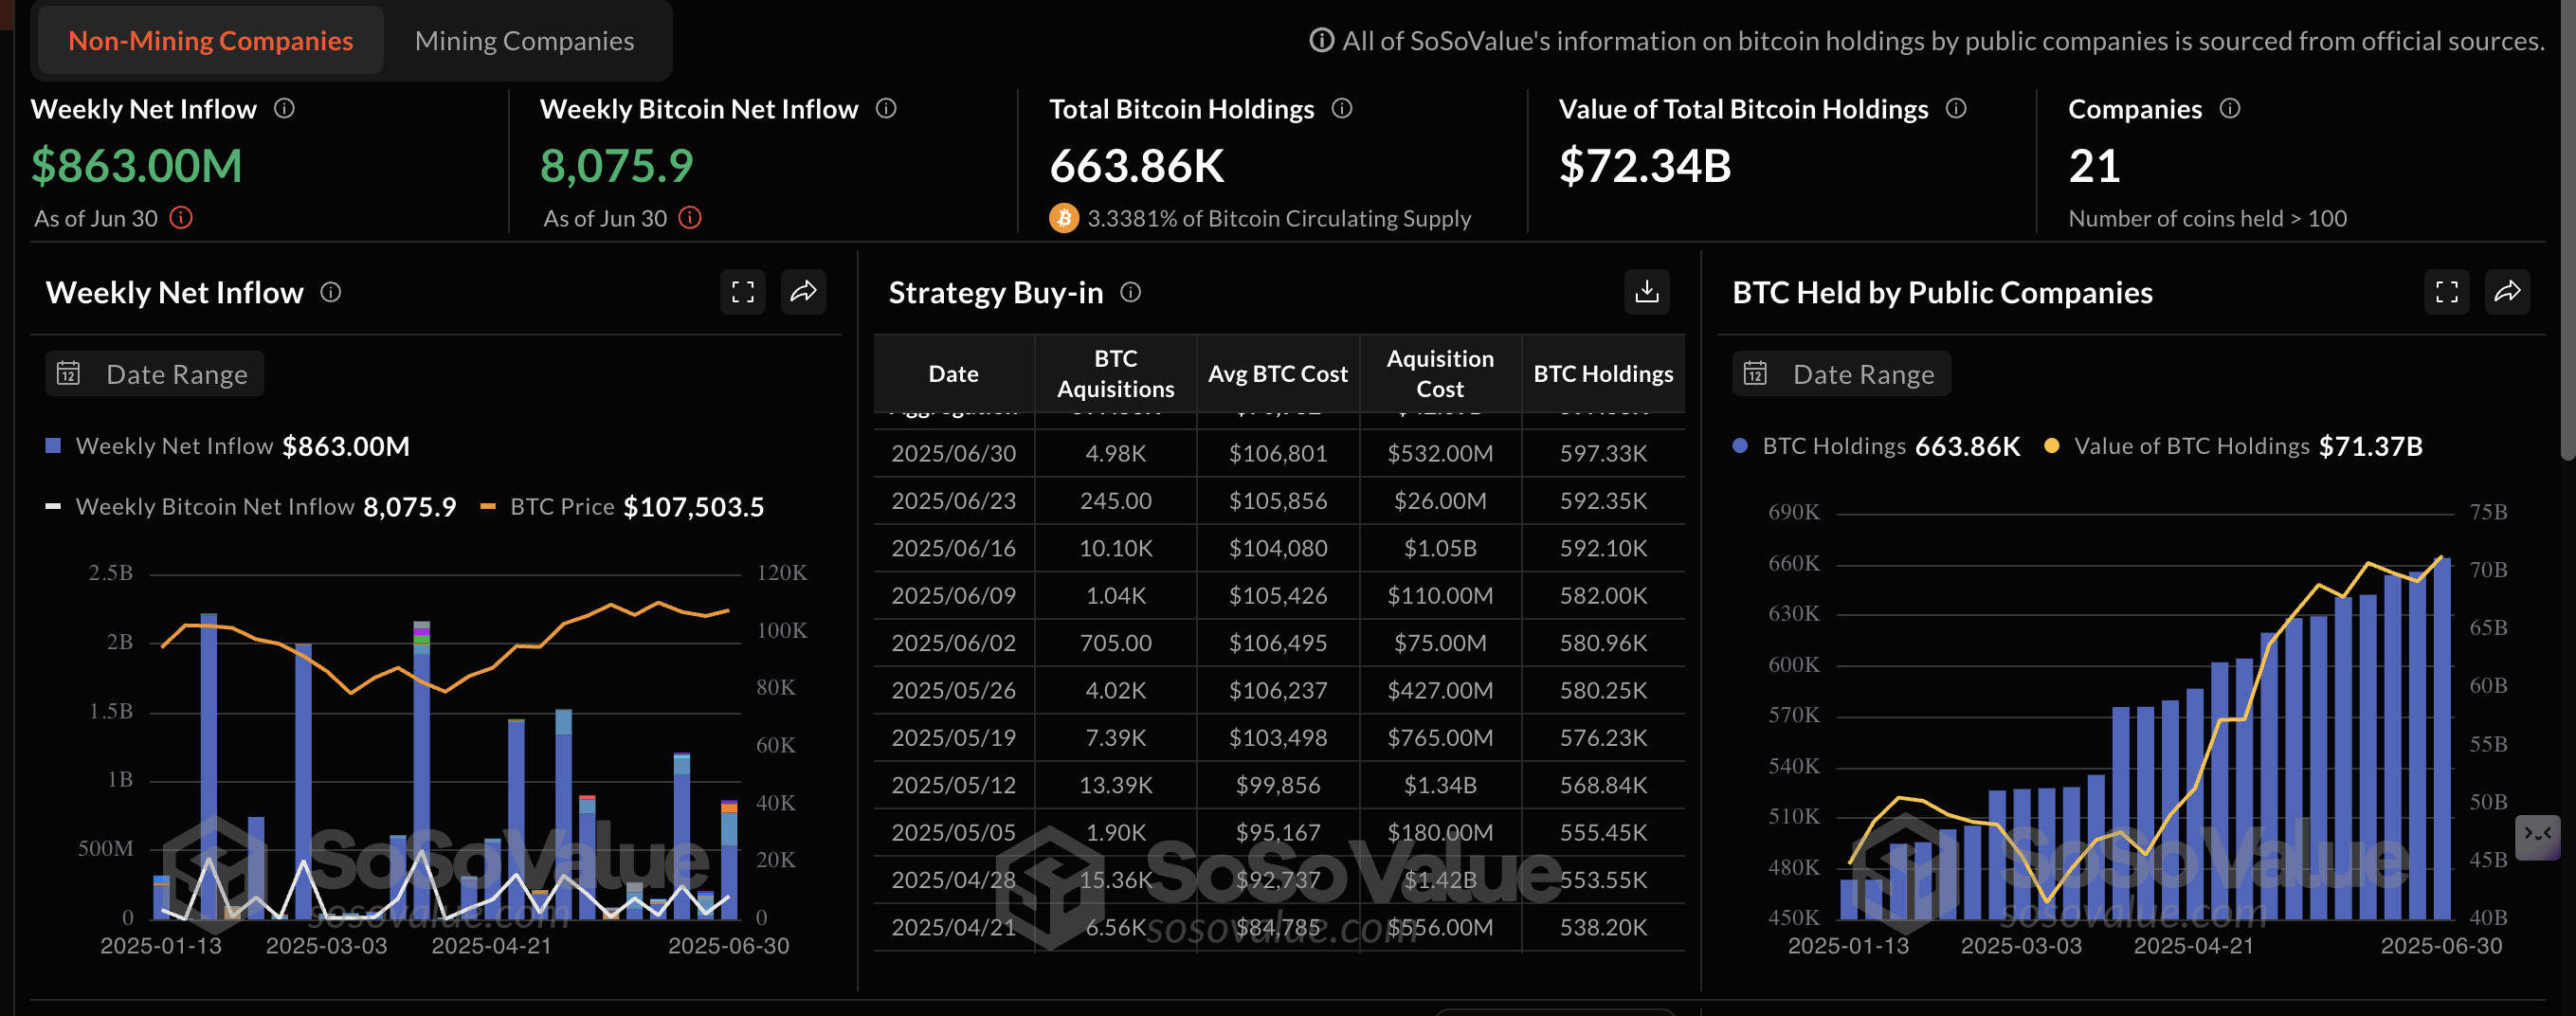
Bitcoin treasuries data | Source: SoSoValue
Regarding institutional demand, BlackRock's iShares Bitcoin Trust ETF (IBIT) has grown, becoming competitive on Wall Street as one of the asset manager's top revenue-generating Exchange Traded Funds (ETFs).
According to the K33 Research "The Week in Crypto" report, IBIT beat BlackRock's "flagship iShares Core S&P 500 ETF (IVV) in annual fees despite IVV's far larger asset base." The spot BTC ETF generates an estimated $187.2 million in annual revenue, compared to the $187.1 million generated by IVV.
Data spotlight: Bitcoin ETF inflows steady
Bitcoin spot ETFs recorded a total daily net inflow of approximately $602 billion on Thursday, boosting the cumulative total net inflow of the 12 products licensed in the United States (US) near the $50 billion mark.
The total net assets average $138 billion, with around $2.51 billion traded on Thursday. Fidelity's FBTC ETF topped inflows with $237 million, followed by BlackRock's IBIT with $225 million. None of the ETFs posted outflows, underscoring institutional interest in Bitcoin as a strategic asset for corporations.
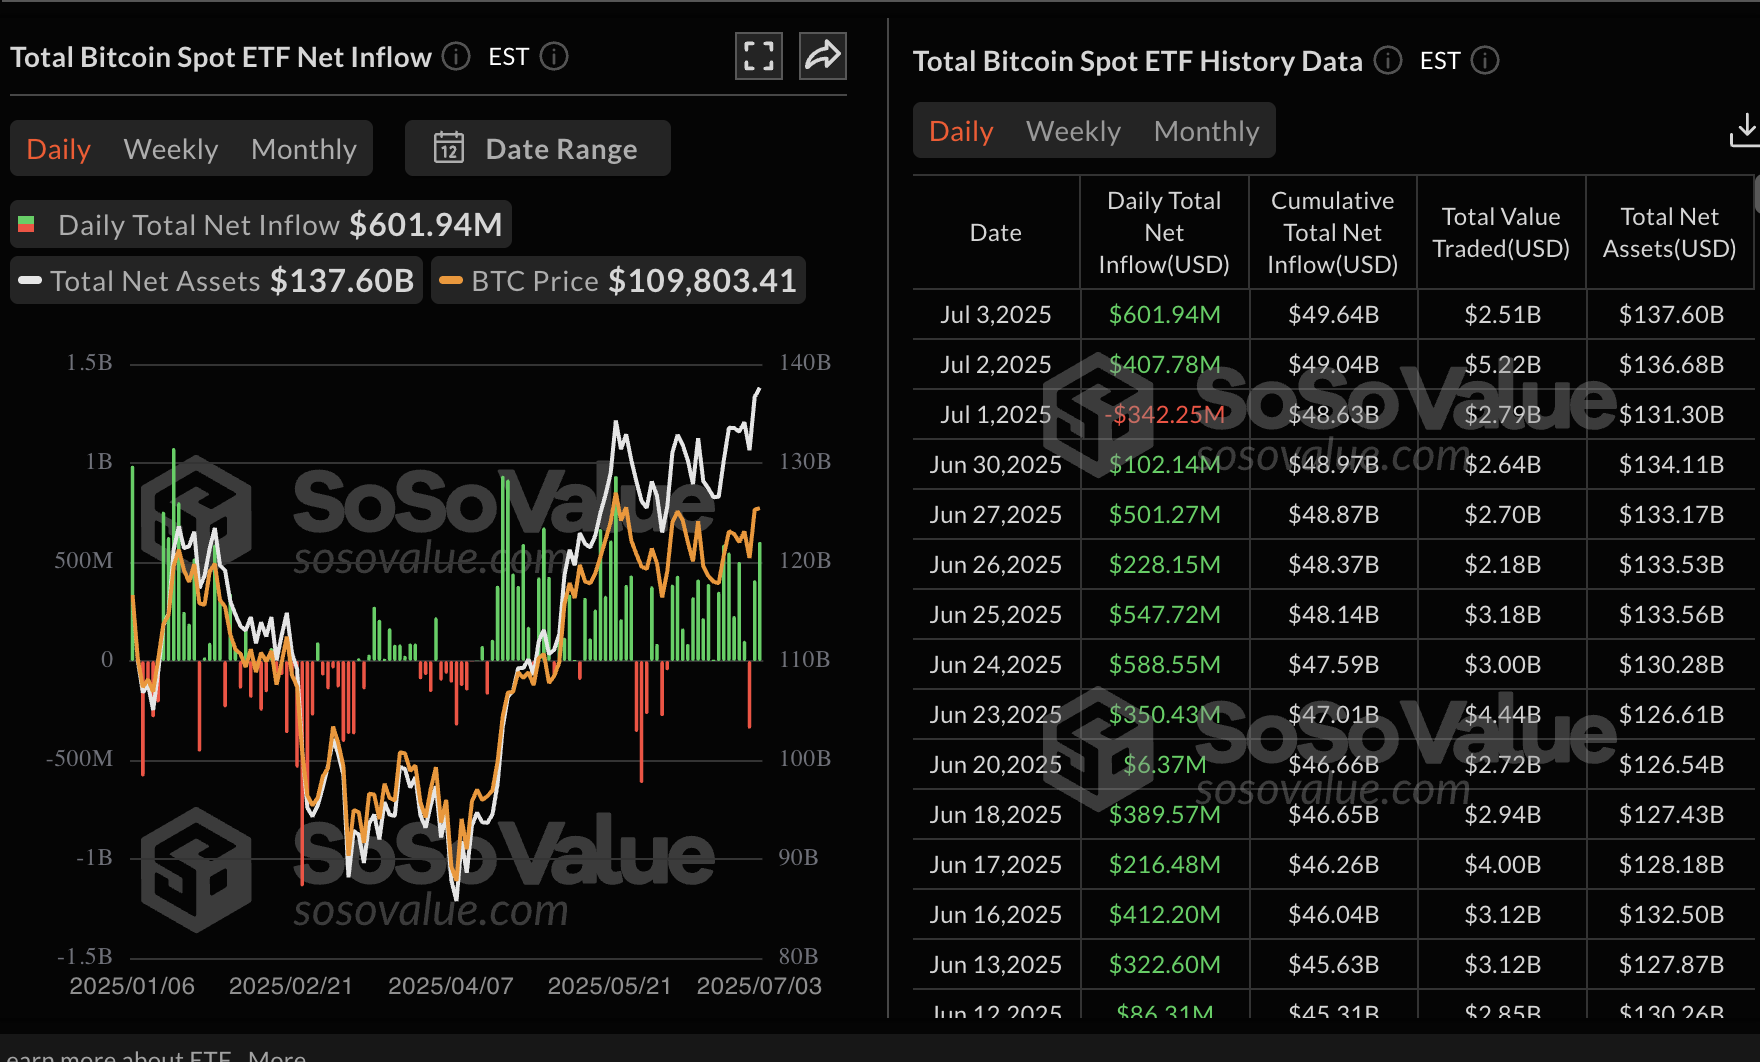
Bitcoin spot ETF data | Source: SoSoValue
On the other hand, the net inflow of Ethereum spot ETFs resumed on Thursday, with over $148 million streaming in. The uptick follows a $1.82 million outflow experienced on Wednesday. The cumulative total net inflow stands at $4.4 billion, with net assets totaling $10.83 million.
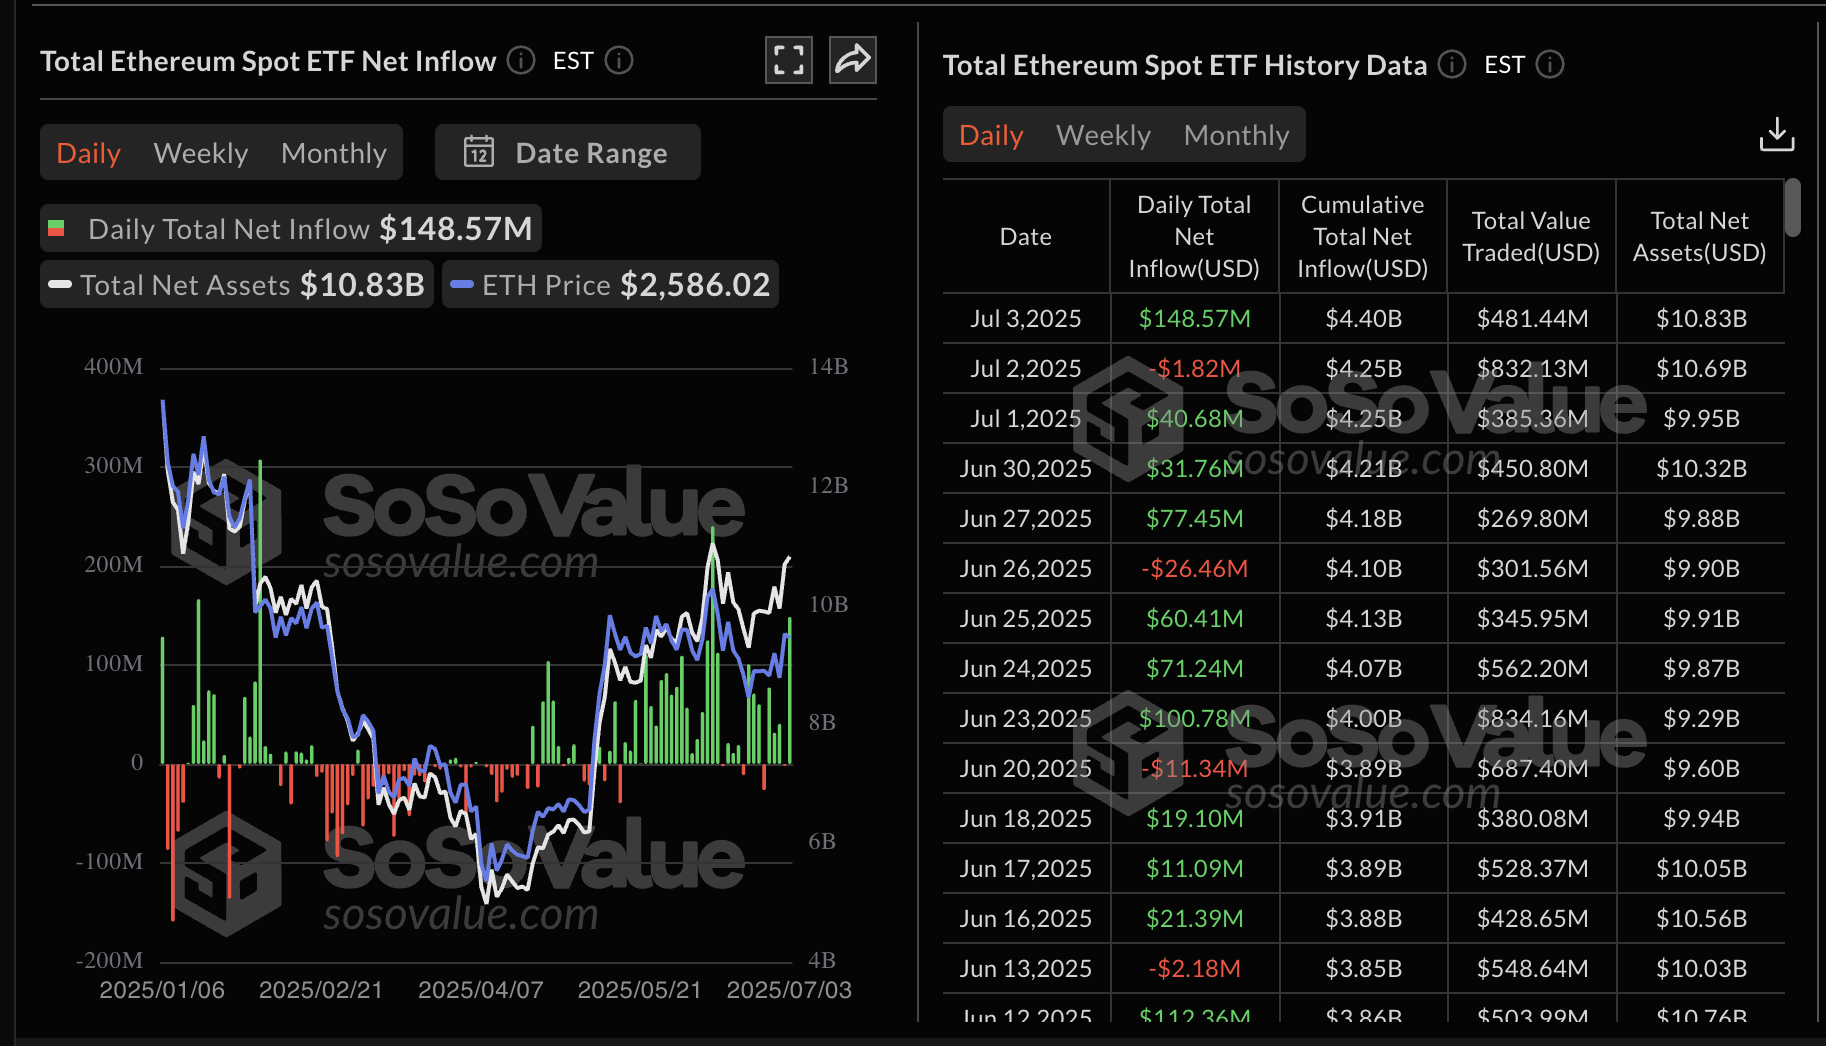
Ethereum spot ETF data | Source: SoSoValue
Chart of the day: Bitcoin eyes new all-time highs
Bitcoin's price holds above the recent broken descending trendline as bulls push for stability ahead of another recovery attempt toward the all-time high of around $111,980.
Despite the correction from Thursday's peak of $110,530, BTC's technical structure appears stable. This bullish outlook can be attributed to a buy signal from the Moving Average Convergence Divergence (MACD) indicator, which has been maintained since Wednesday.
If the blue MACD line holds above the red signal line, the risk-on sentiment will prevail, thus encouraging traders to seek exposure. Another break above resistance at $110,530 could see bulls expand their scope above all-time highs, favoring a price discovery phase.
Other bullish cues include the upward-facing moving averages, including the 50-day Exponential Moving Average (EMA) at $104,730, the 100-day EMA at $100,934 and the 200-day EMA at $95,126. In the event of an accelerated trend reversal, these levels could serve as tentative support.
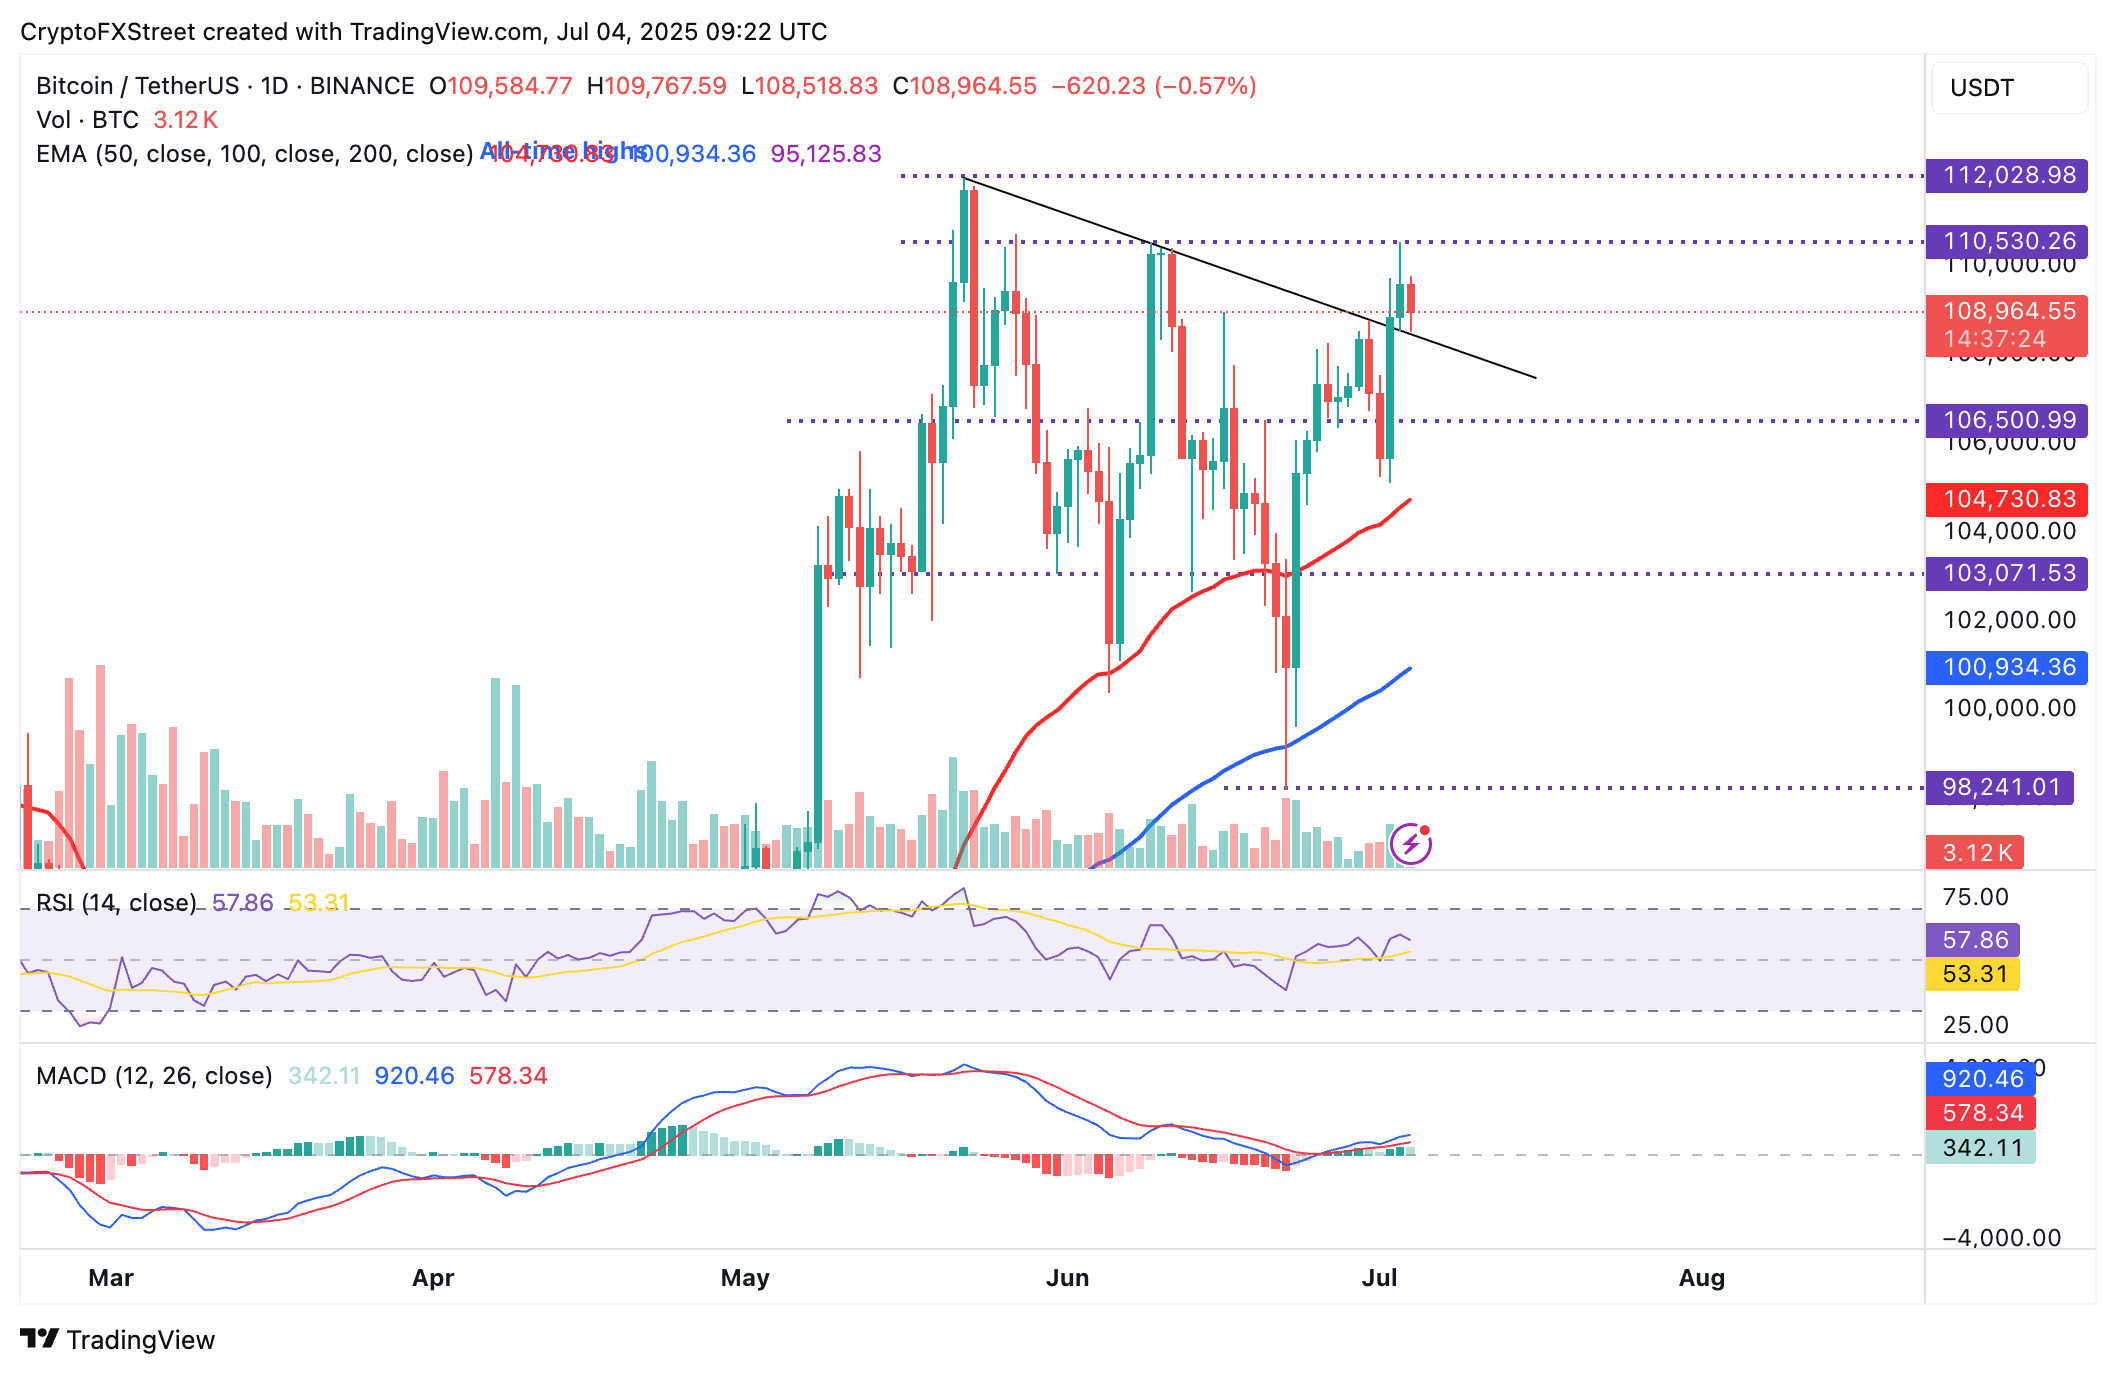
BTC/USD daily chart
Altcoins update: Ethereum, XRP recovery stalls
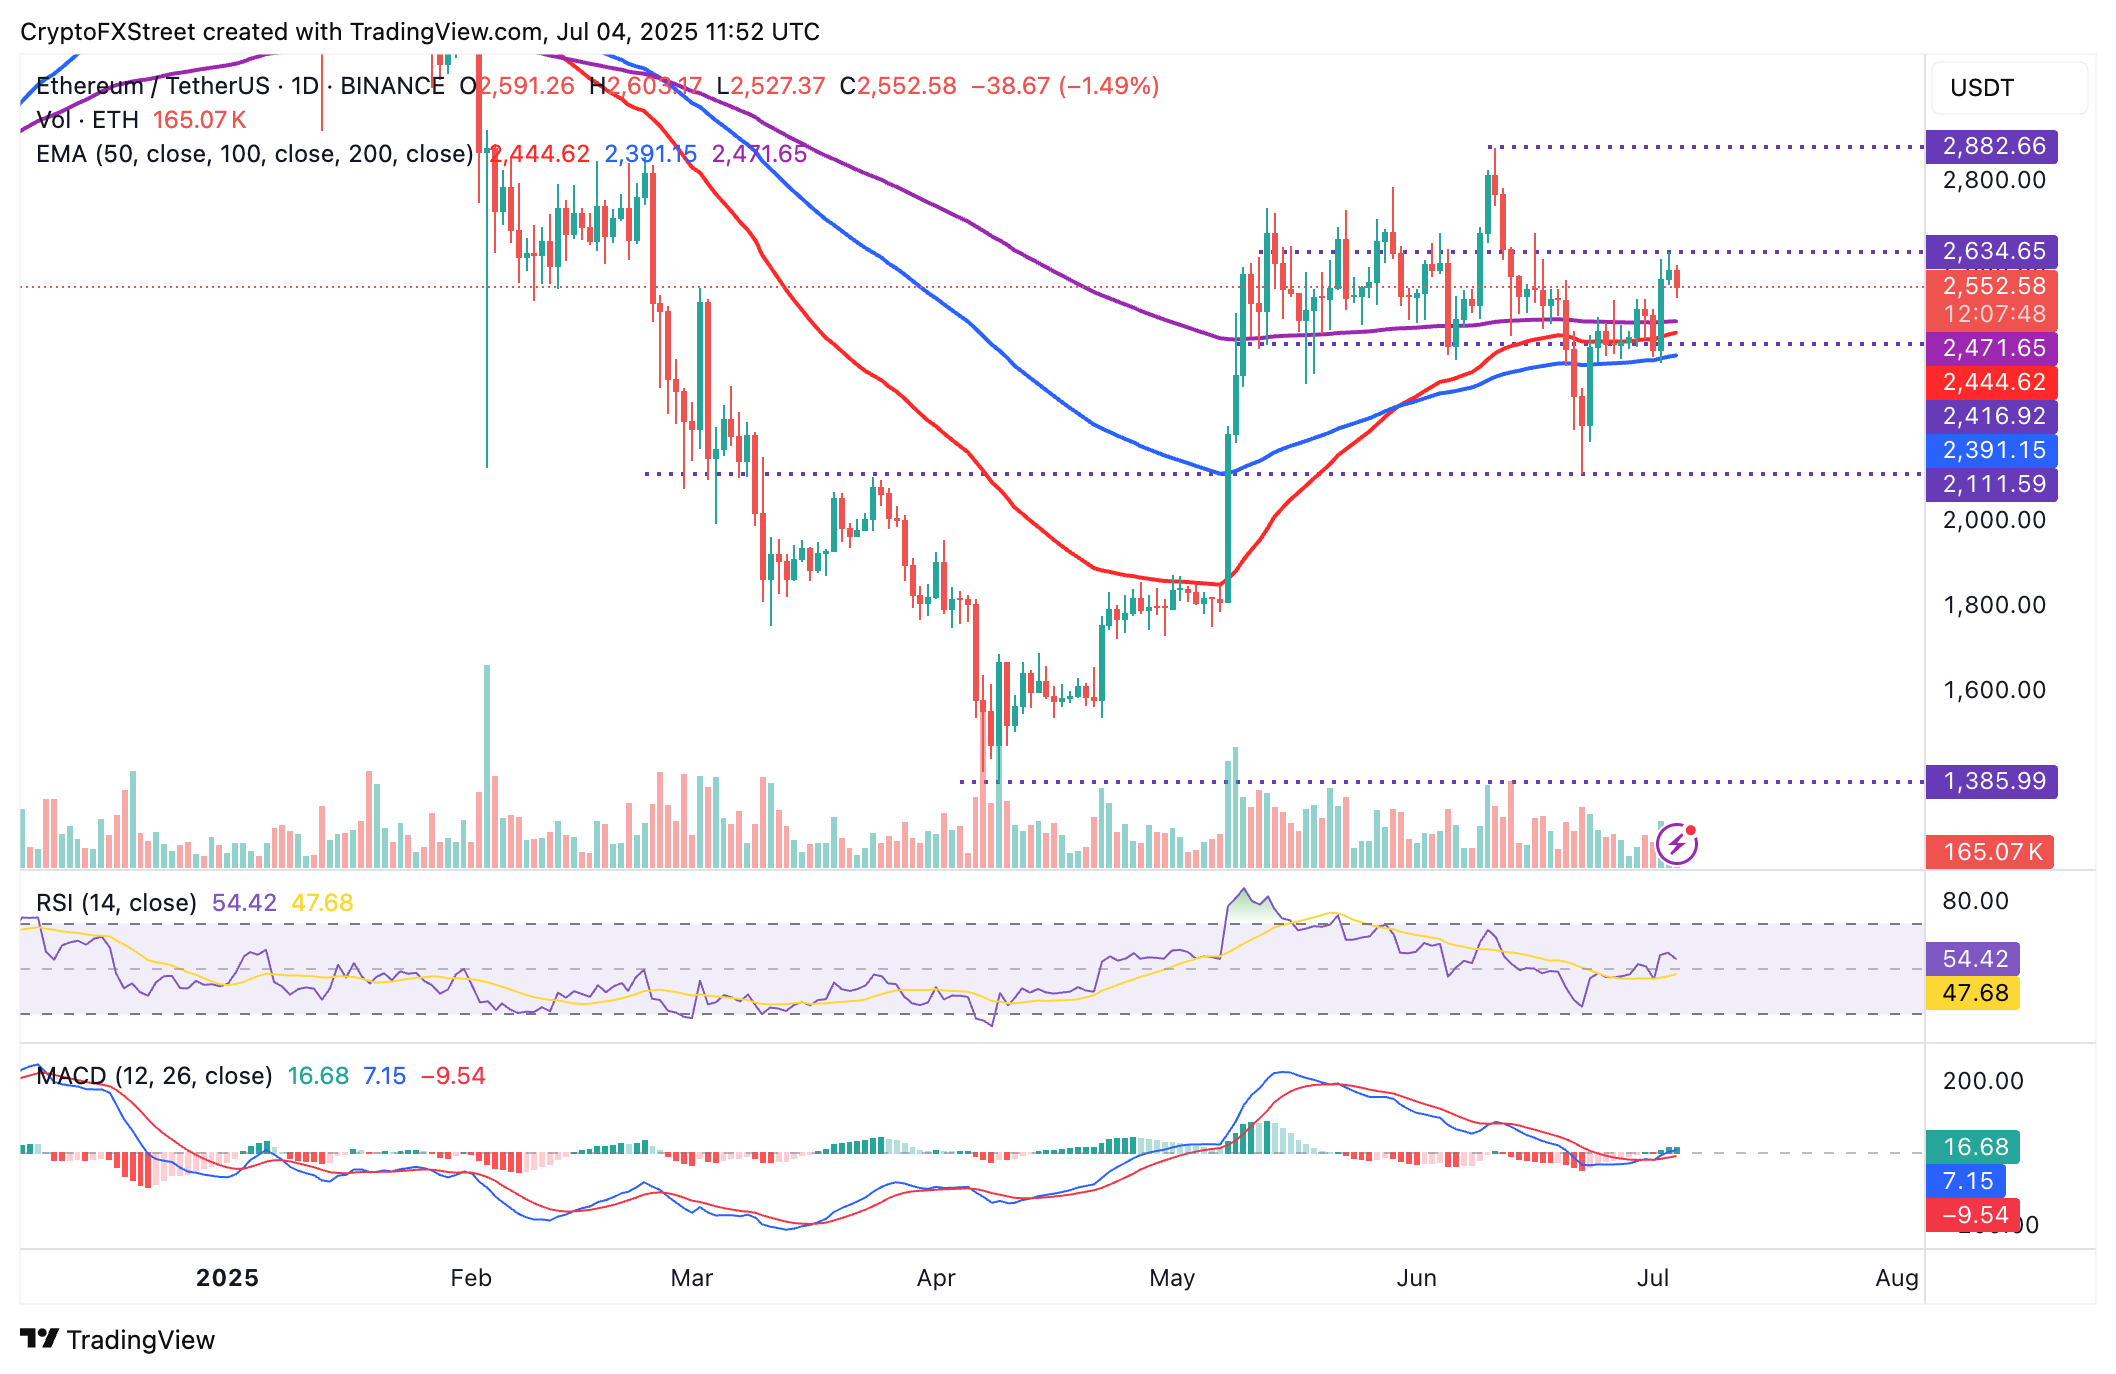
Ethereum staged a recovery on Wednesday, which was extended to Thursday, but snapped at $2,634. The largest smart contracts token has since retreated, trading at $2,552 at the time of writing.
The Relative Strength Index (RSI) is showing signs of reversing the trend after reaching a high of 57. Its continued decline could cast doubt on ETH's bullish outlook and encourage risk-off sentiment.
Still, the MACD indicator upholds a buy signal triggered on Wednesday. If investors heed the signal and buy Ethereum, the subsequent increase in demand could overshadow the current sell-side pressure.
Key areas to keep in mind are $2,634, probed on Thursday, and the highest peak in June at $2,882. On the other hand, the 200-day EMA at $2,471, the 50-day EMA at $ 2,444, and the 100-day EMA at $2,391 would serve as support levels in the event of the decline extending.
ETH/USDT daily chart
As for XRP, upward price movement remains capped below a longstanding descending trendline resistance, as observed on the daily chart below. Ripple's focus on expanding its stablecoin infrastructure on the XRP Ledger (XRPL) has failed to steady the recovery toward the $3.00 round-figure target.
The minor intraday correction is testing support at $2.22 provided by the 100-day EMA, while the 50-day EMA lies slightly below $2.21. In case bearish momentum mounts, there is a need to prepare for a potential 5.8% drop to the 200-day EMA support at $2.10.
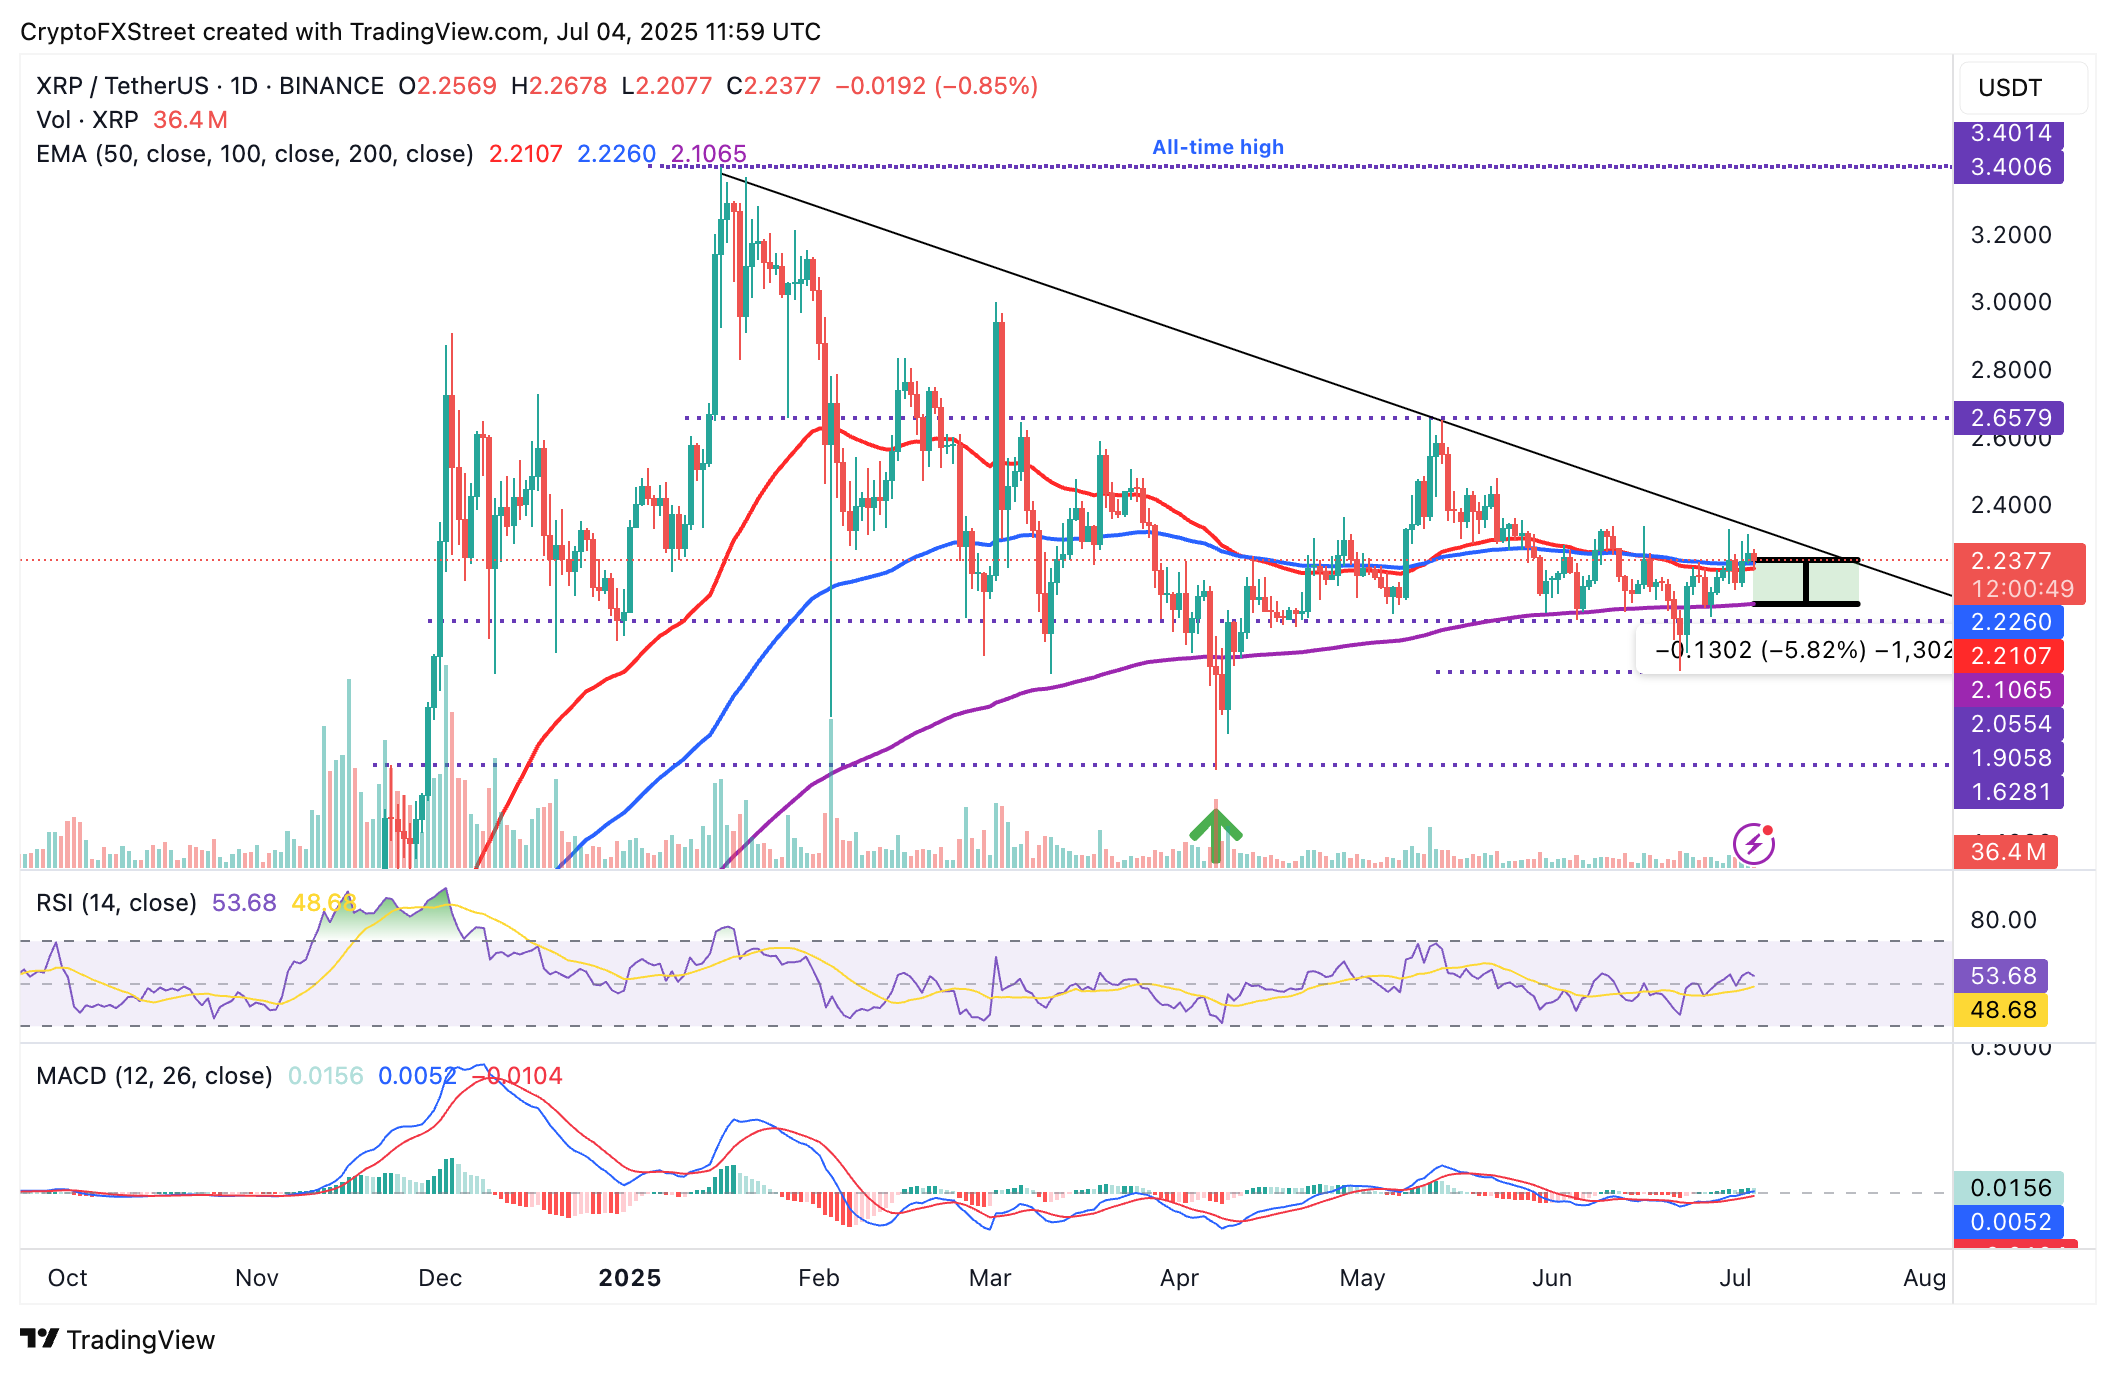
XRP/USDT daily chart
Still, an immediate trend reversal from the 100-day EMA support at $2.22 cannot be ruled out yet. If broader market sentiment improves, the price of XRP could resume its recovery, targeting the peak reached in June at $2.65.
Cryptocurrency metrics FAQs
The developer or creator of each cryptocurrency decides on the total number of tokens that can be minted or issued. Only a certain number of these assets can be minted by mining, staking or other mechanisms. This is defined by the algorithm of the underlying blockchain technology. On the other hand, circulating supply can also be decreased via actions such as burning tokens, or mistakenly sending assets to addresses of other incompatible blockchains.
Market capitalization is the result of multiplying the circulating supply of a certain asset by the asset’s current market value.
Trading volume refers to the total number of tokens for a specific asset that has been transacted or exchanged between buyers and sellers within set trading hours, for example, 24 hours. It is used to gauge market sentiment, this metric combines all volumes on centralized exchanges and decentralized exchanges. Increasing trading volume often denotes the demand for a certain asset as more people are buying and selling the cryptocurrency.
Funding rates are a concept designed to encourage traders to take positions and ensure perpetual contract prices match spot markets. It defines a mechanism by exchanges to ensure that future prices and index prices periodic payments regularly converge. When the funding rate is positive, the price of the perpetual contract is higher than the mark price. This means traders who are bullish and have opened long positions pay traders who are in short positions. On the other hand, a negative funding rate means perpetual prices are below the mark price, and hence traders with short positions pay traders who have opened long positions.
Author

John Isige
FXStreet
John Isige is a seasoned cryptocurrency journalist and markets analyst committed to delivering high-quality, actionable insights tailored to traders, investors, and crypto enthusiasts. He enjoys deep dives into emerging Web3 tren


