Crypto Today: Bitcoin, Ethereum, XRP stall as focus shifts to Jackson Hole
- Bitcoin trades near $114,000, remaining steady after a turbulent start to the week.
- Ethereum hints at a bullish lift off in a rising channel pattern.
- Ripple’s XRP holds above a crucial support level as bulls eye reclaiming $3.00.

Bitcoin (BTC), Ethereum (ETH), and Ripple (XRP) remain steady at press time on Thursday, following minor turbulence after the release of the Federal Open Market Committee (FOMC) meeting minutes on Wednesday. The meetings set the tone for the US Jackson Hole economic policy symposium, which starts on Thursday, focusing on transitions in the labor market.
Additionally, the market is looking forward to the Fed Chairman Jerome Powell’s final Jackson Hole speech on Day 2 (Friday) amid the impending 25 basis point interest rate cut potentially in September.
Bitcoin trades near the $114,000 level, holding above a crucial support amid a Death Cross pattern on the 4-hour chart. Ethereum, on the other hand, prepares a lift off within a rising channel pattern while XRP struggles to reclaim the $3.00 level.
Bitcoin in a gridlock faces increasing pressure
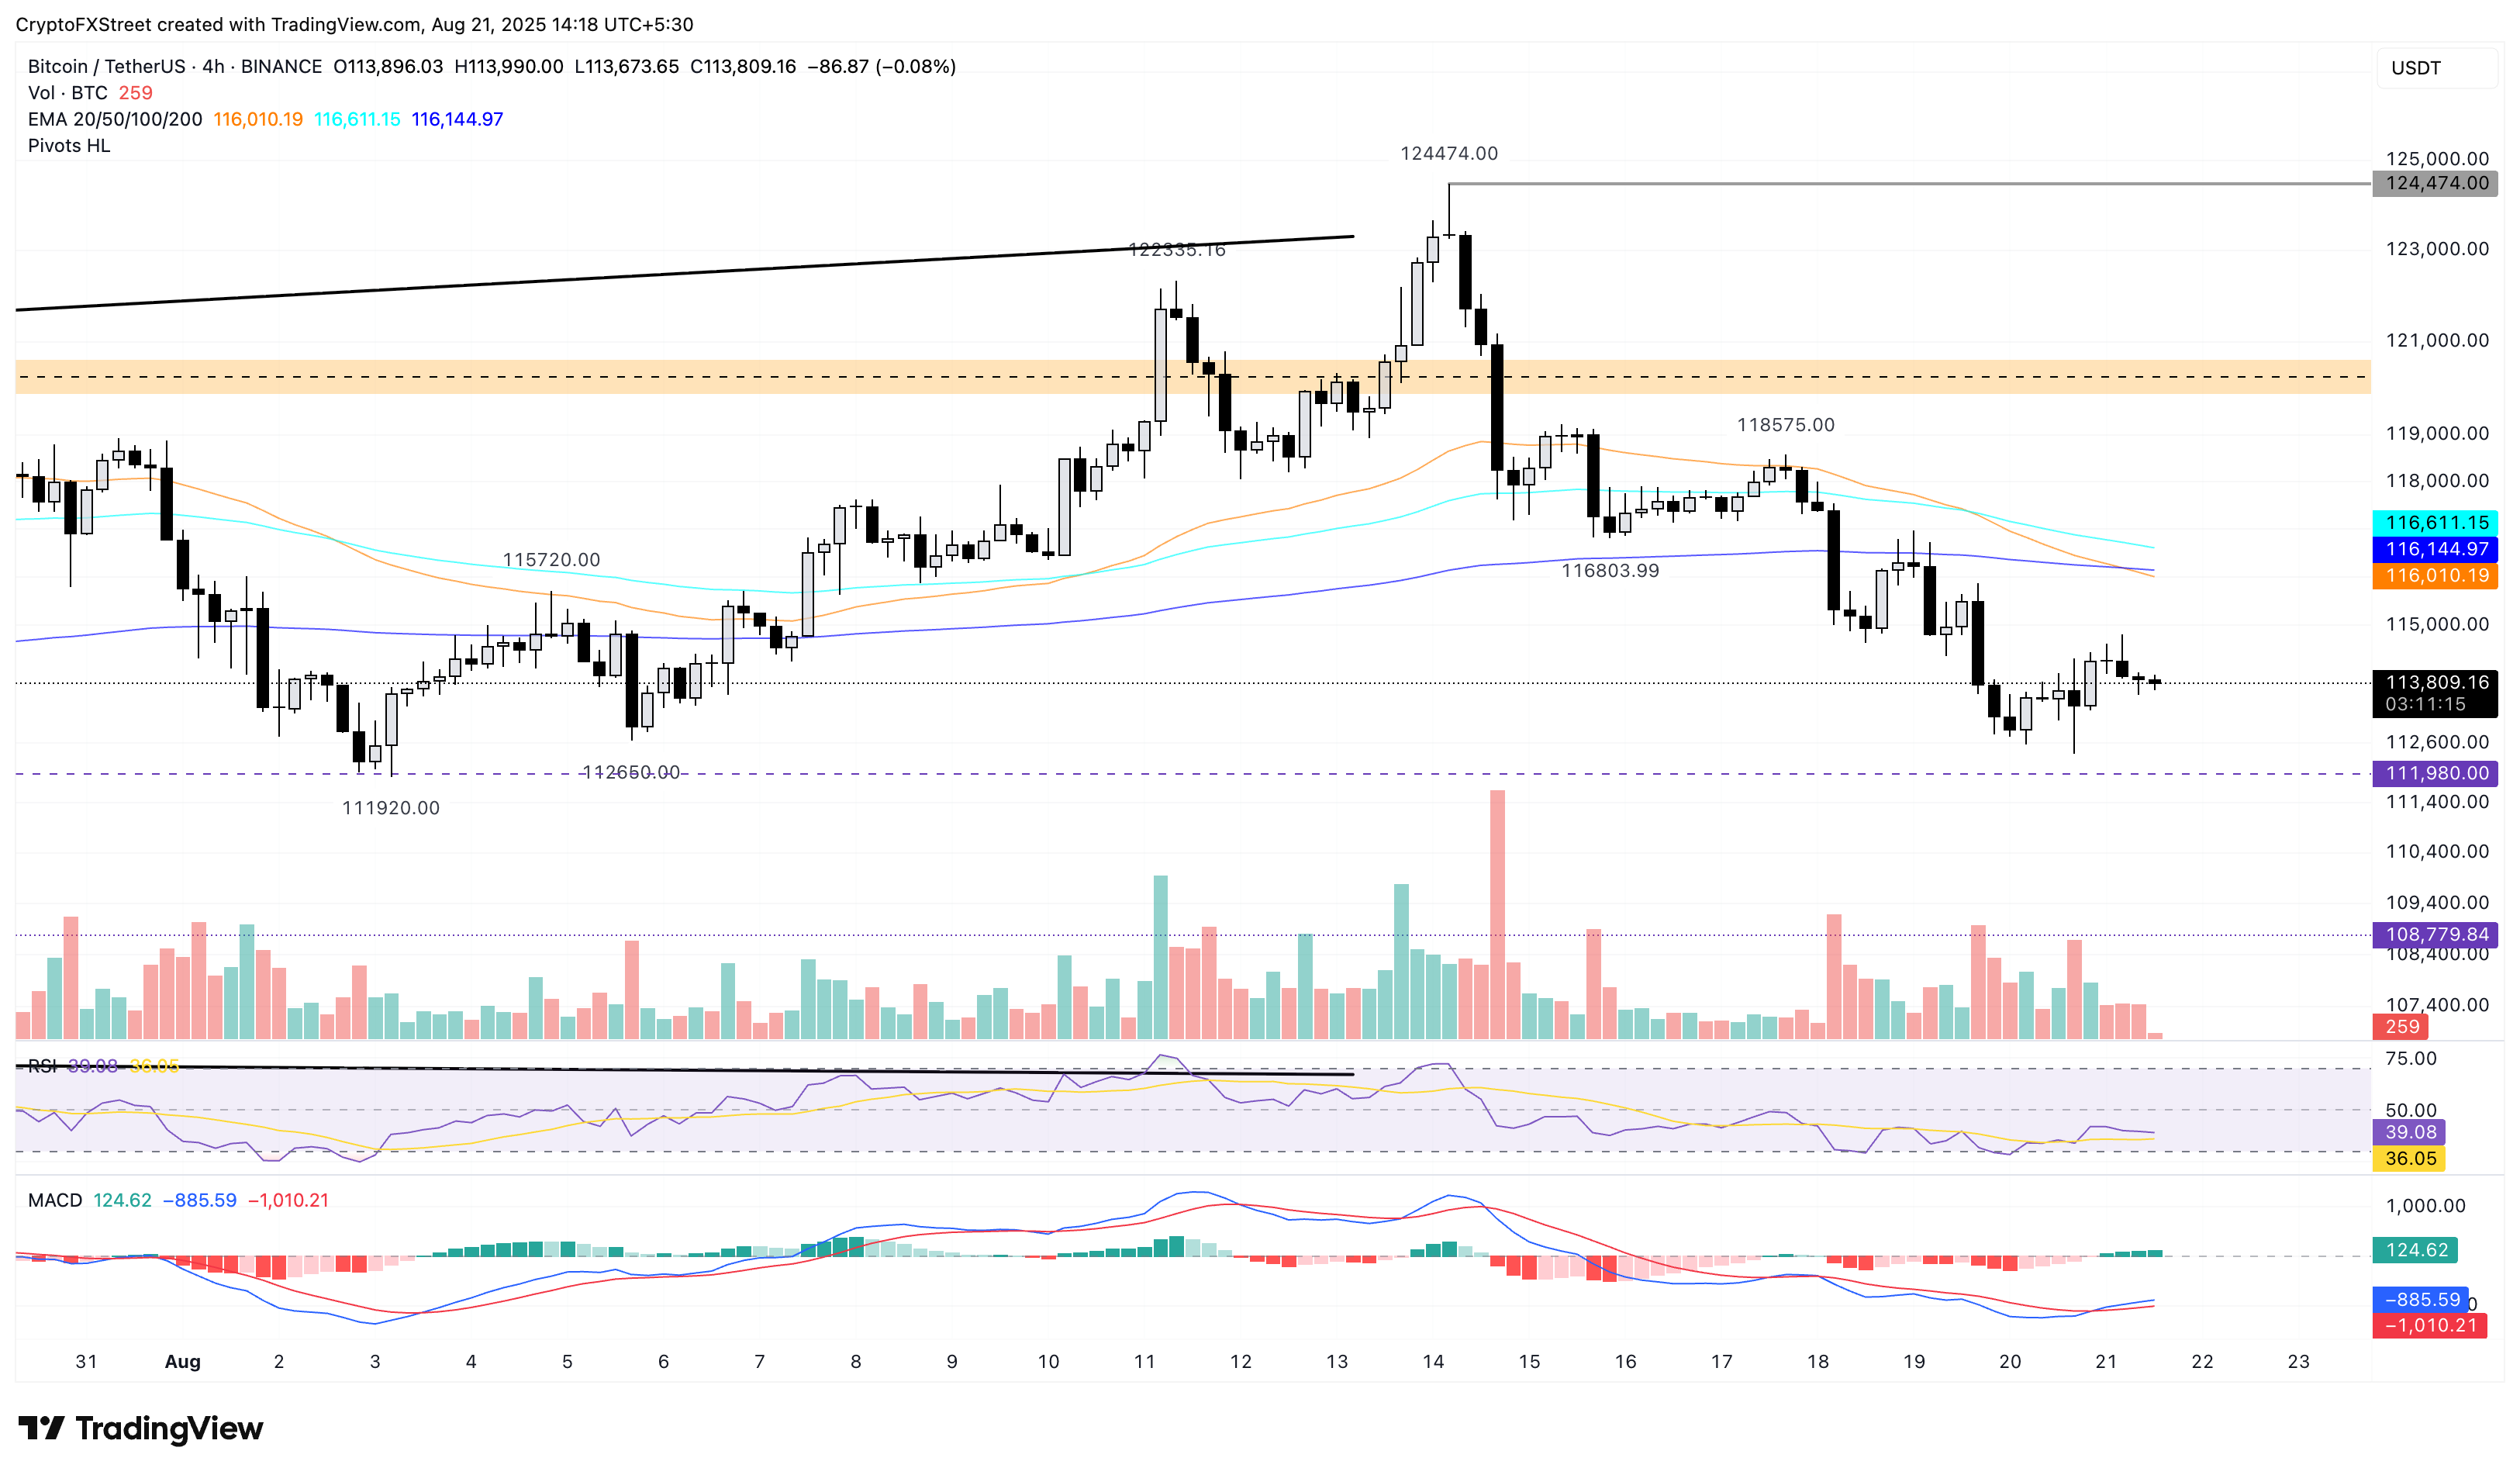
Bitcoin takes a sideways shift above the $111,980 support level on the 4-hour chart, following a sharp pullback earlier this week. The declining trend resulted in a Death Cross pattern between the 50- and 200-period Exponential Moving Averages (EMAs) on the same chart.
The Relative Strength Index (RSI) is at 39 on the 4-hour chart, moving flat above the oversold boundary line, indicating heightened selling pressure. Still, the Moving Average Convergence Divergence (MACD) crosses above its signal line, indicating a rise in bullish momentum.
If Bitcoin slips below the $111,980 support level, it could extend the decline to $108,779, marked by the low of July 4.
BTC/USDT daily price chart.
On the contrary, a bounce back in Bitcoin could target the 50-period EMA at $116,010.
Ethereum aims to take off within a bullish channel
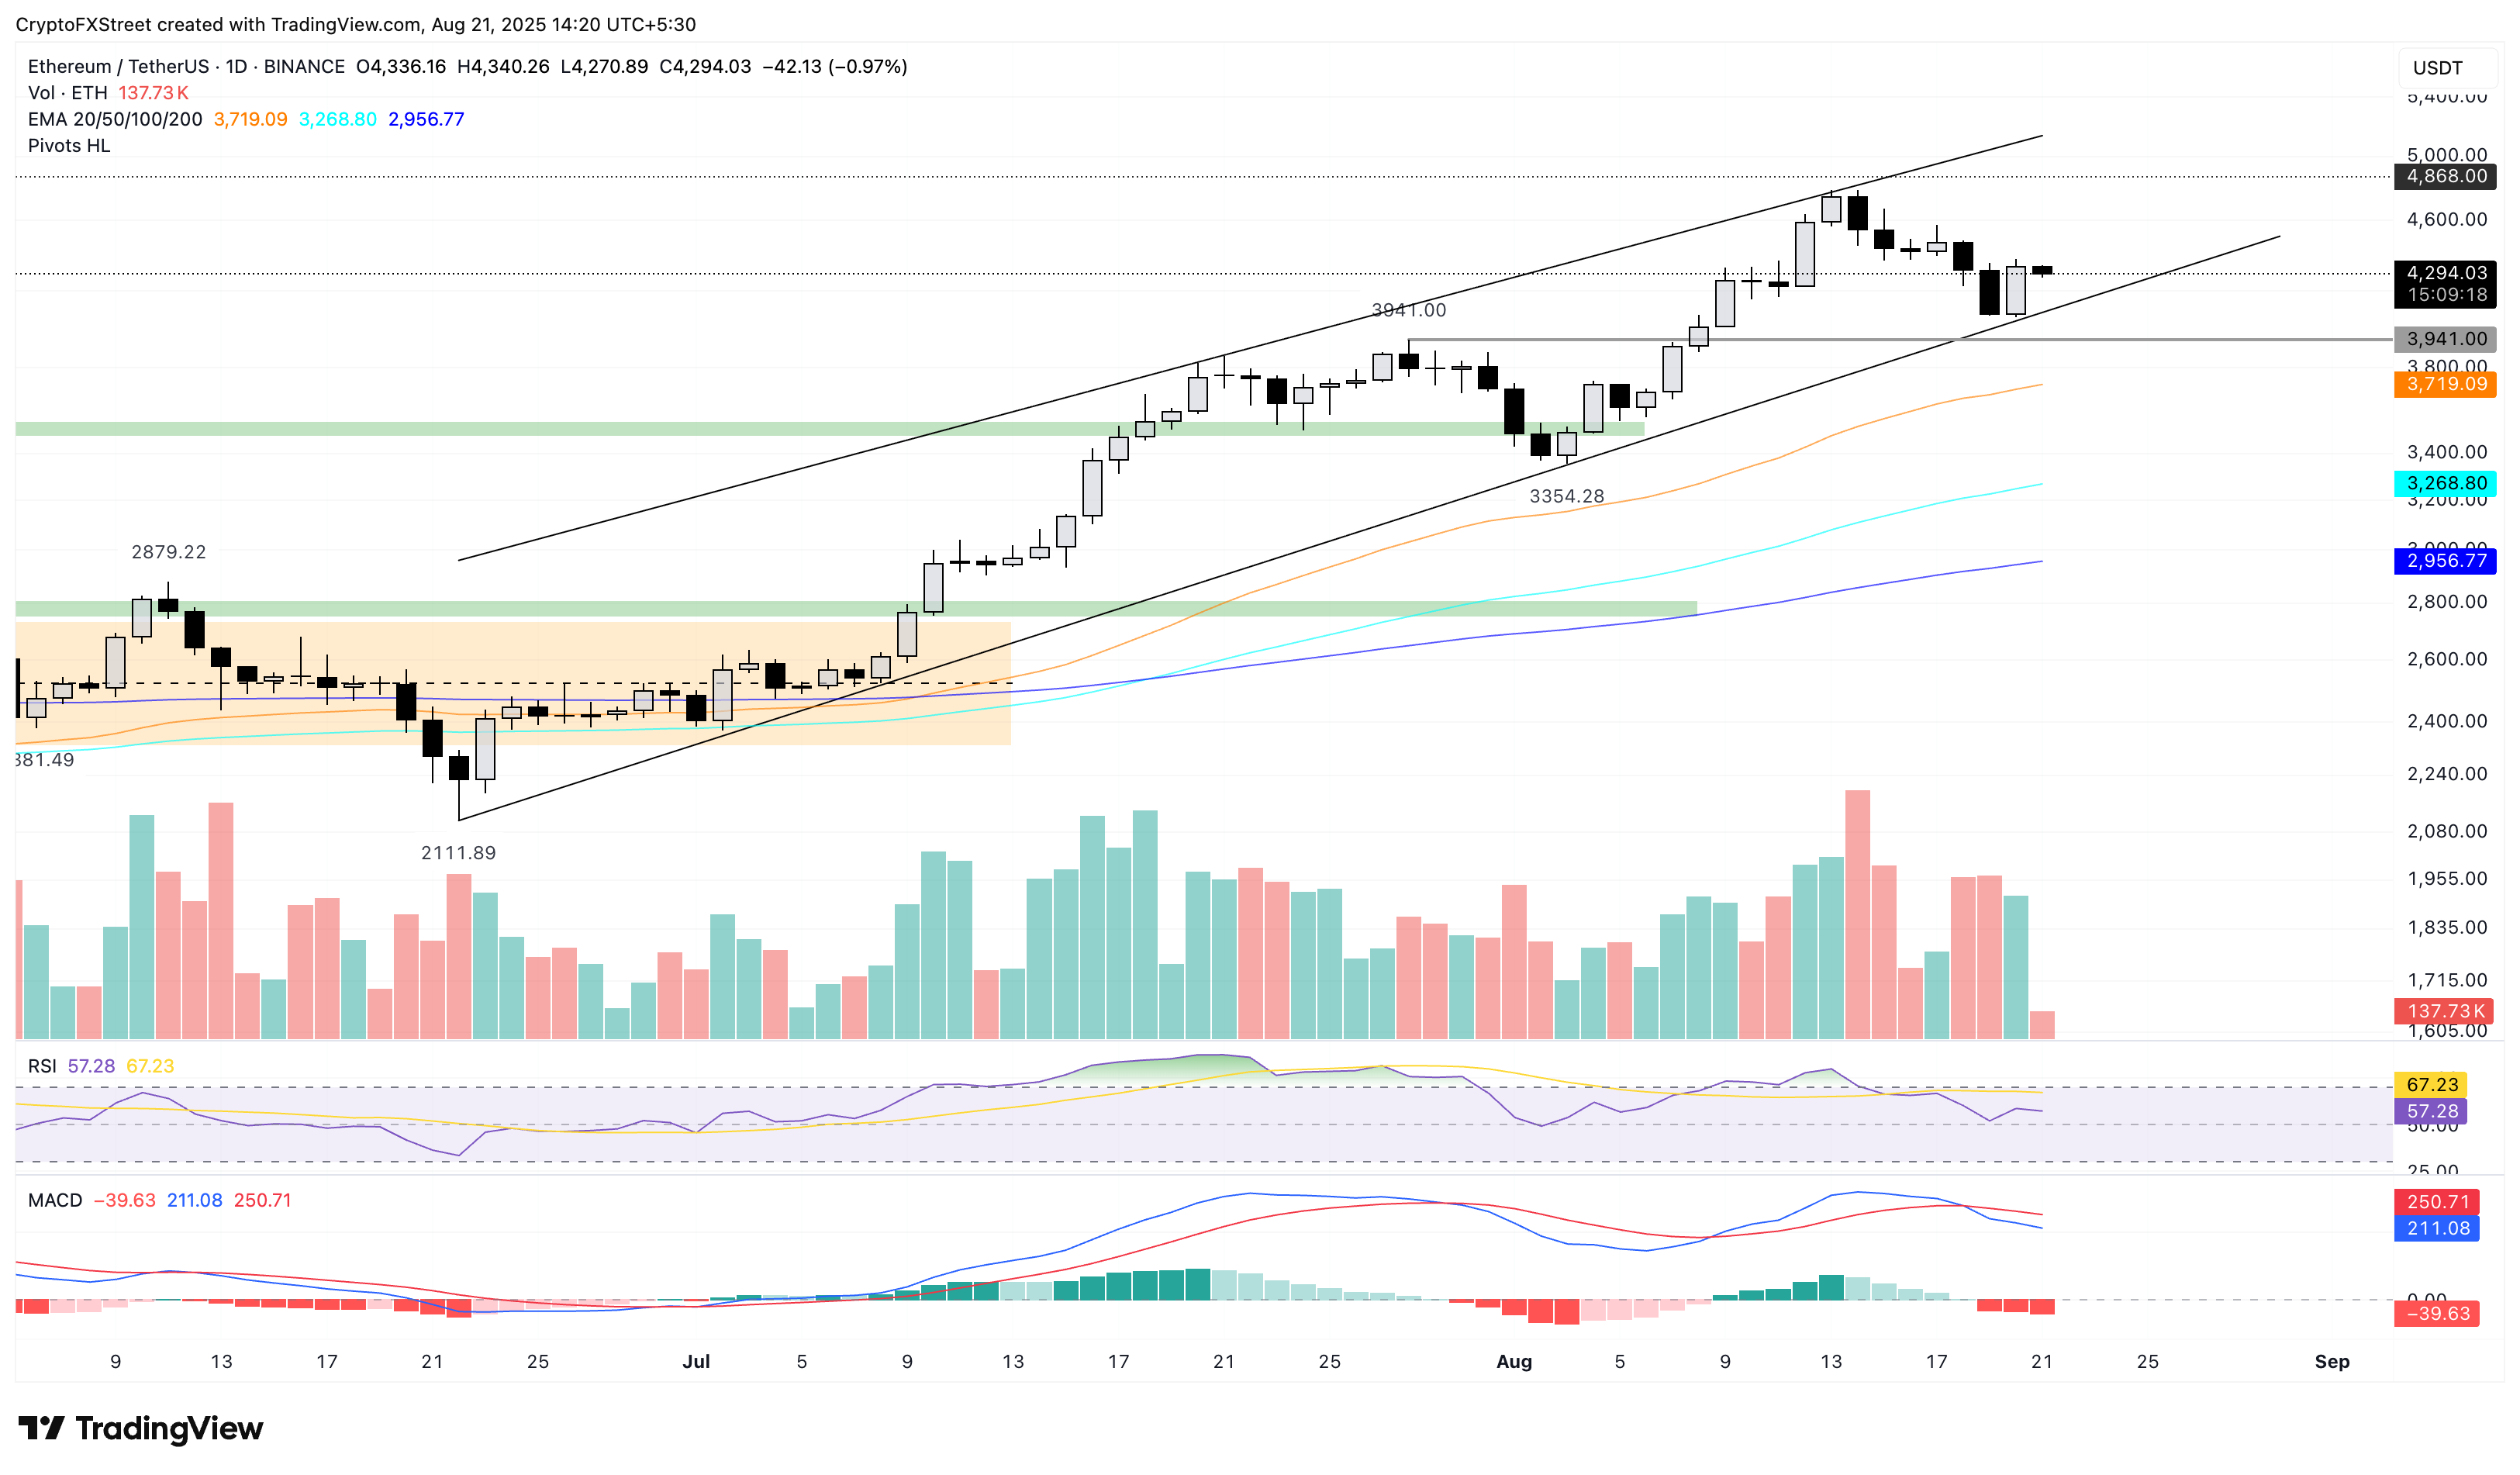
Ethereum holds steady on Thursday, holding the 6.39% rise from the previous day. The largest altcoin by market capitalization bounces off the support trendline of a rising channel pattern on the daily chart (shared below).
The reversal run within the bullish parallel channel targets the all-time high of $4,868, followed by the upper resistance trendline near the $5,000 psychological milestone.
The momentum indicators flash mixed signals as underlying confidence among traders declines. On the daily chart, the RSI stands at 57, moving parallel to the midpoint as buying pressure remains steady. Still, the MACD crossed below its signal line on Tuesday and continues to decline, indicating increasing bearish momentum.
ETH/USDT daily price chart.
On the other hand, if Ethereum reverses at the start of the Jackson Hole economic policy symposium, it could extend the decline to the lower boundary of the rising channel, near $4,094.
XRP in a quicksand risks further losses
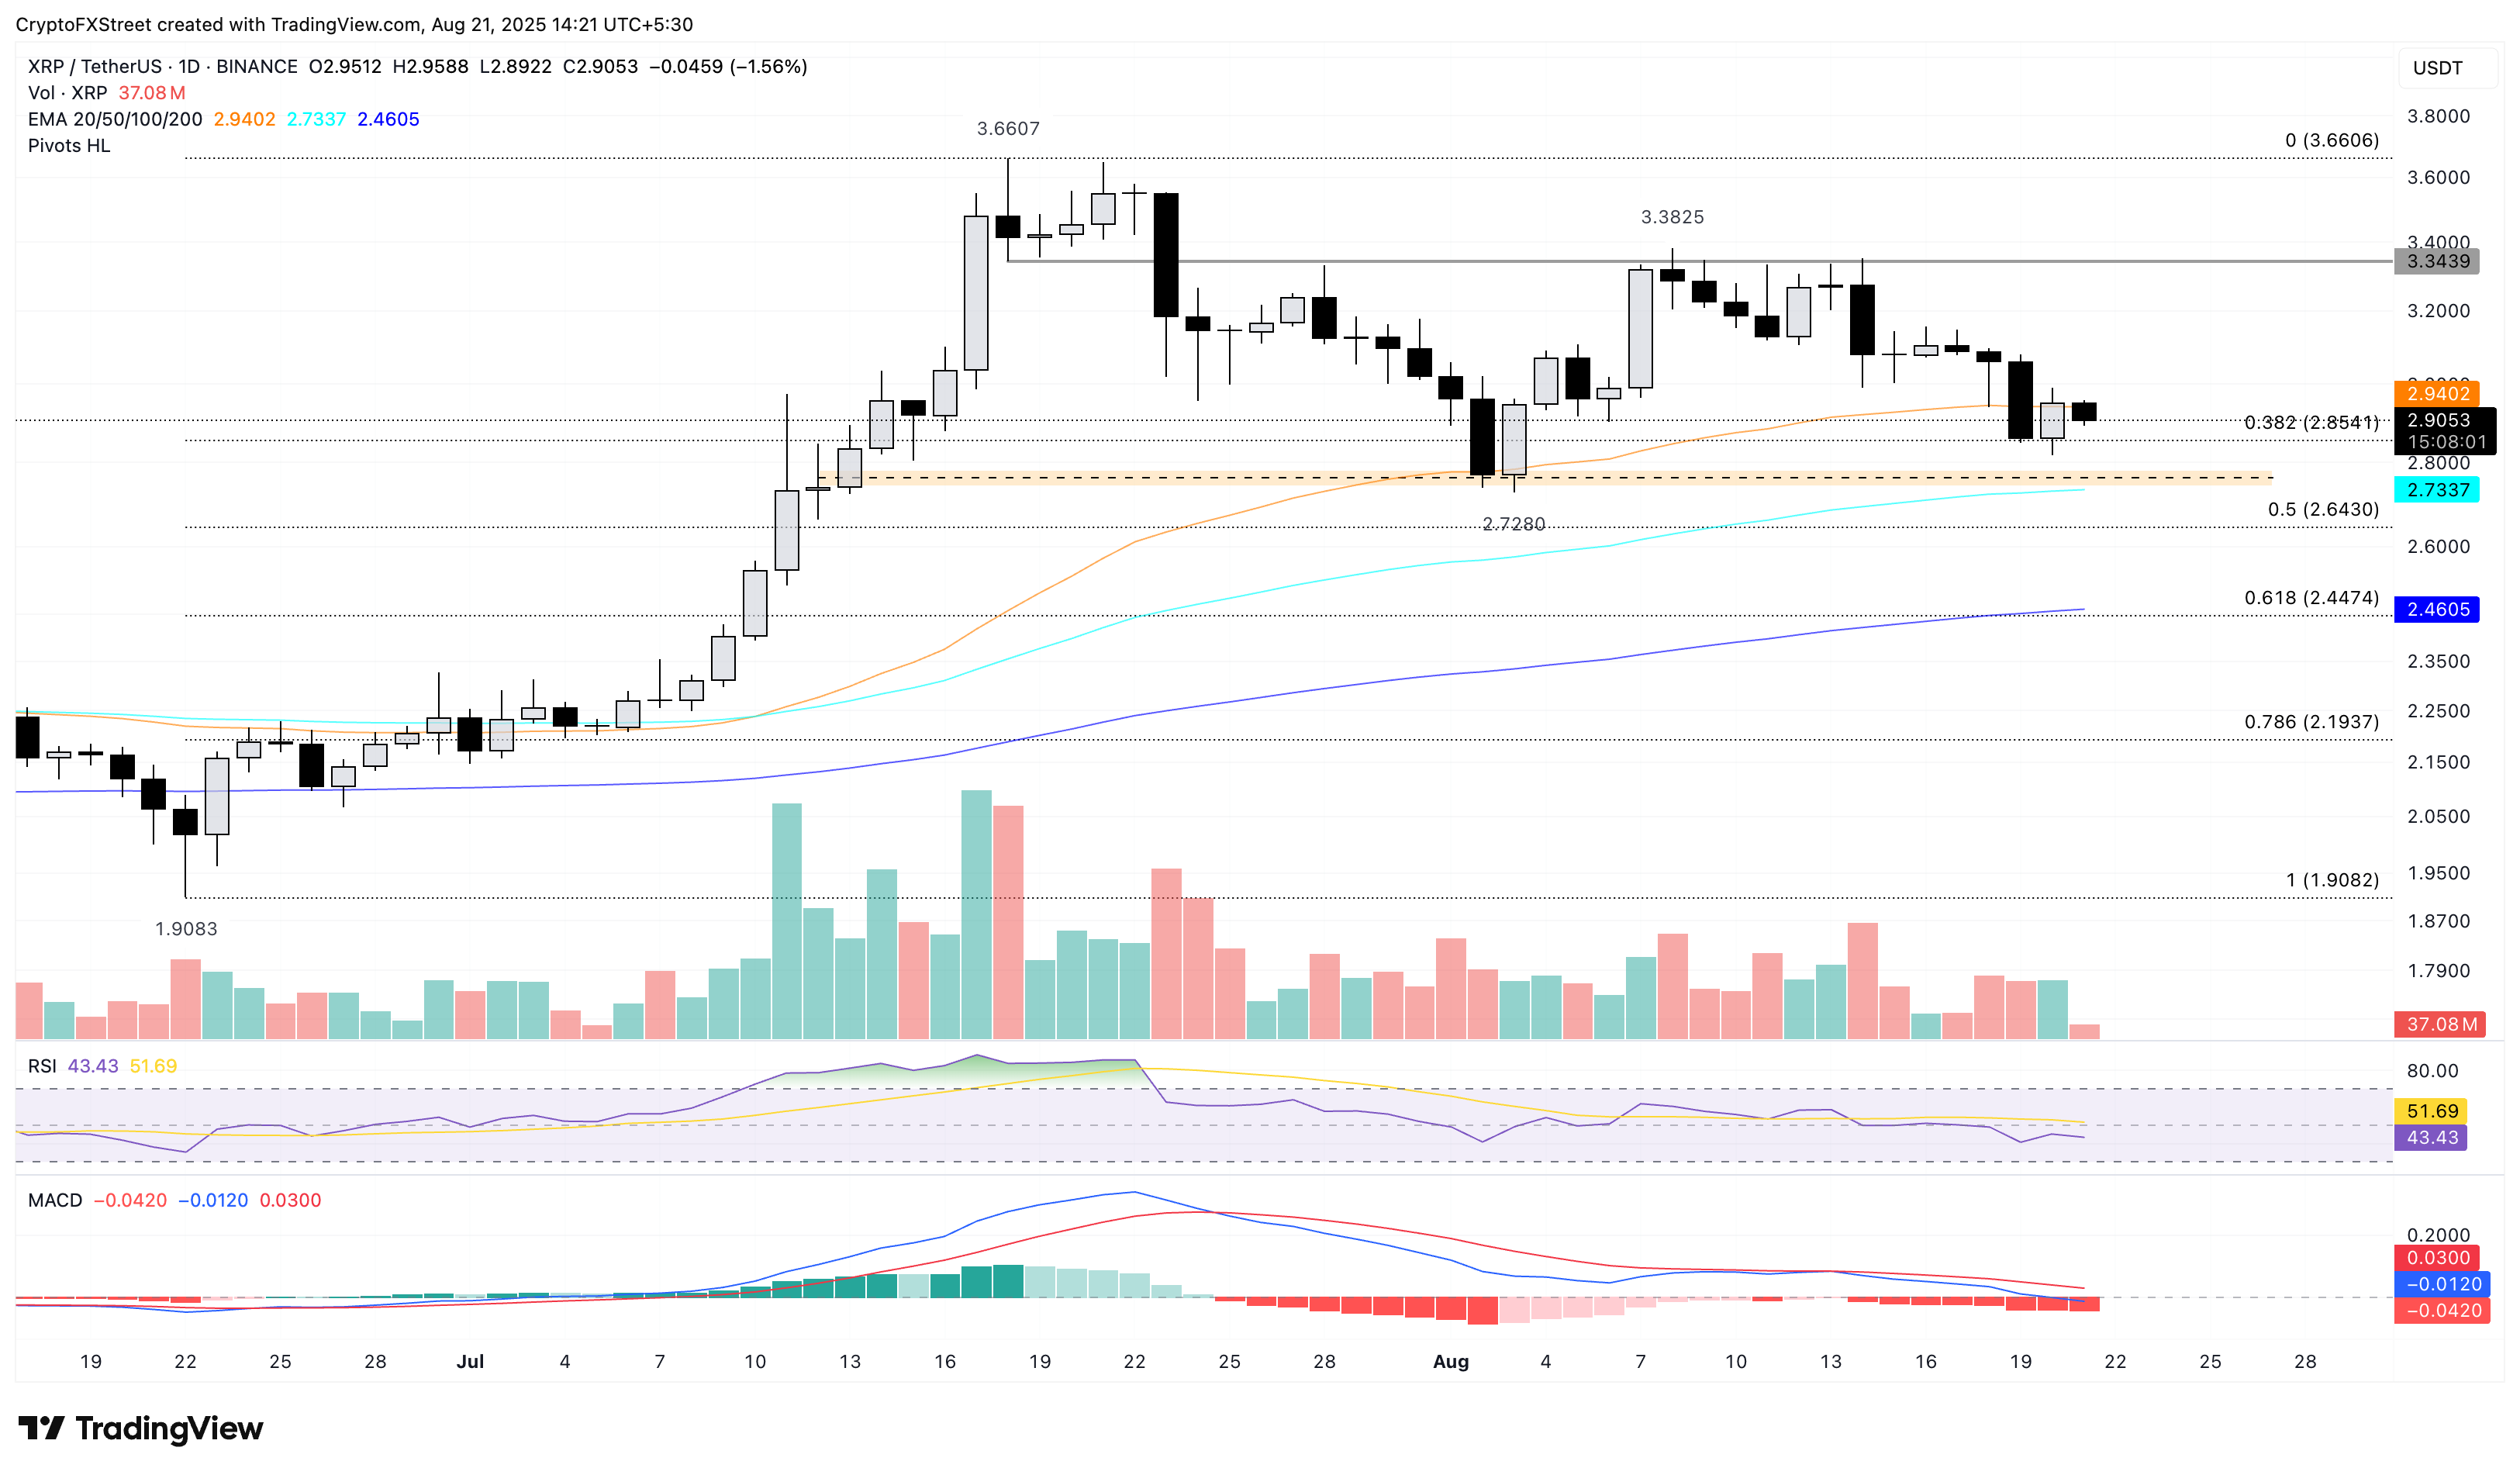
Ripple’s XRP loses ground by over 1.50% at press time on Thursday, reversing from the 50-day EMA at $2.94. The cross-border remittance token holds above the 38.2% Fibonacci level at $2.85, which is drawn from a low of $1.90 on June 22 to a high of $3.66 on July 18.
A slip below this level could further drive the decline in XRP to the 100-day EMA $2.73.
The bearish grip persists over the momentum indicator on the daily chart. The declining trend in the MACD and its signal line approaches the zero line, indicating a boost in bearish momentum. Additionally, the RSI is at 43, sloping downwards as buying pressure continues to decline.
XRP/USDT daily price chart.
Looking up, XRP should reclaim the 50-day EMA at $2.94 to reinforce a bullish trend, potentially targeting the $3.34 resistance, last tested on August 14.
Open Interest, funding rate FAQs
Higher Open Interest is associated with higher liquidity and new capital inflow to the market. This is considered the equivalent of increase in efficiency and the ongoing trend continues. When Open Interest decreases, it is considered a sign of liquidation in the market, investors are leaving and the overall demand for an asset is on a decline, fueling a bearish sentiment among investors.
Funding fees bridge the difference between spot prices and prices of futures contracts of an asset by increasing liquidation risks faced by traders. A consistently high and positive funding rate implies there is a bullish sentiment among market participants and there is an expectation of a price hike. A consistently negative funding rate for an asset implies a bearish sentiment, indicating that traders expect the cryptocurrency’s price to fall and a bearish trend reversal is likely to occur.
Author

Vishal Dixit
FXStreet
Vishal Dixit holds a B.Sc. in Chemistry from Wilson College but found his true calling in the world of crypto.


