Crypto Today: Bitcoin, Ethereum, XRP extend decline amid weakening technical outlook
- Bitcoin edges lower toward the $110,000 level, dragged by declining retail interest.
- Ethereum falls to $4,000, extending the sharp correction seen since the beginning of the week.
- XRP defends the 100-day EMA short-term support, but risks remain tilted to the downside.

Bitcoin (BTC) continues to decline, prolonging the correction that began earlier this week. The technical weakness exhibited by the largest cryptocurrency by market capitalization is potentially driven by low interest from retail investors.
Altcoins, including Ethereum (ETH) and Ripple (XRP), have not been spared the volatility, with price action leaning strongly downward. The ETH price hovers around the $4,000 level, while XRP tests a key support level at $2.83.
Data spotlight: Bitcoin eyes $110,000 as retail interest dwindles
Bitcoin has declined by approximately 3% over the last week, reflecting a sticky risk-off sentiment in the broader cryptocurrency market. The sell-off followed a macro-triggered uptrend, capped near $118,000, as investors positioned themselves ahead of the United States (US) Federal Reserve's (Fed) 25 basis-point interest rate cut on September 17.
Attempts to sustain the uptrend failed, reflecting aggressive profit-taking, particularly among the large-volume holders. The surge in supply has continued to overshadow demand, leaving the Bitcoin price susceptible to losses.
CoinGlass data shows that retail interest began fading on Friday, with the futures Open Interest (OI) dropping to $81.29 billion from $85.79 billion on Thursday.
OI tracks the notional value of outstanding futures contracts; hence, a persistent drop suggests that traders are losing confidence in the market. It also means that sentiment is weakening, as liquidations force traders to close long positions, again contributing to selling pressure.
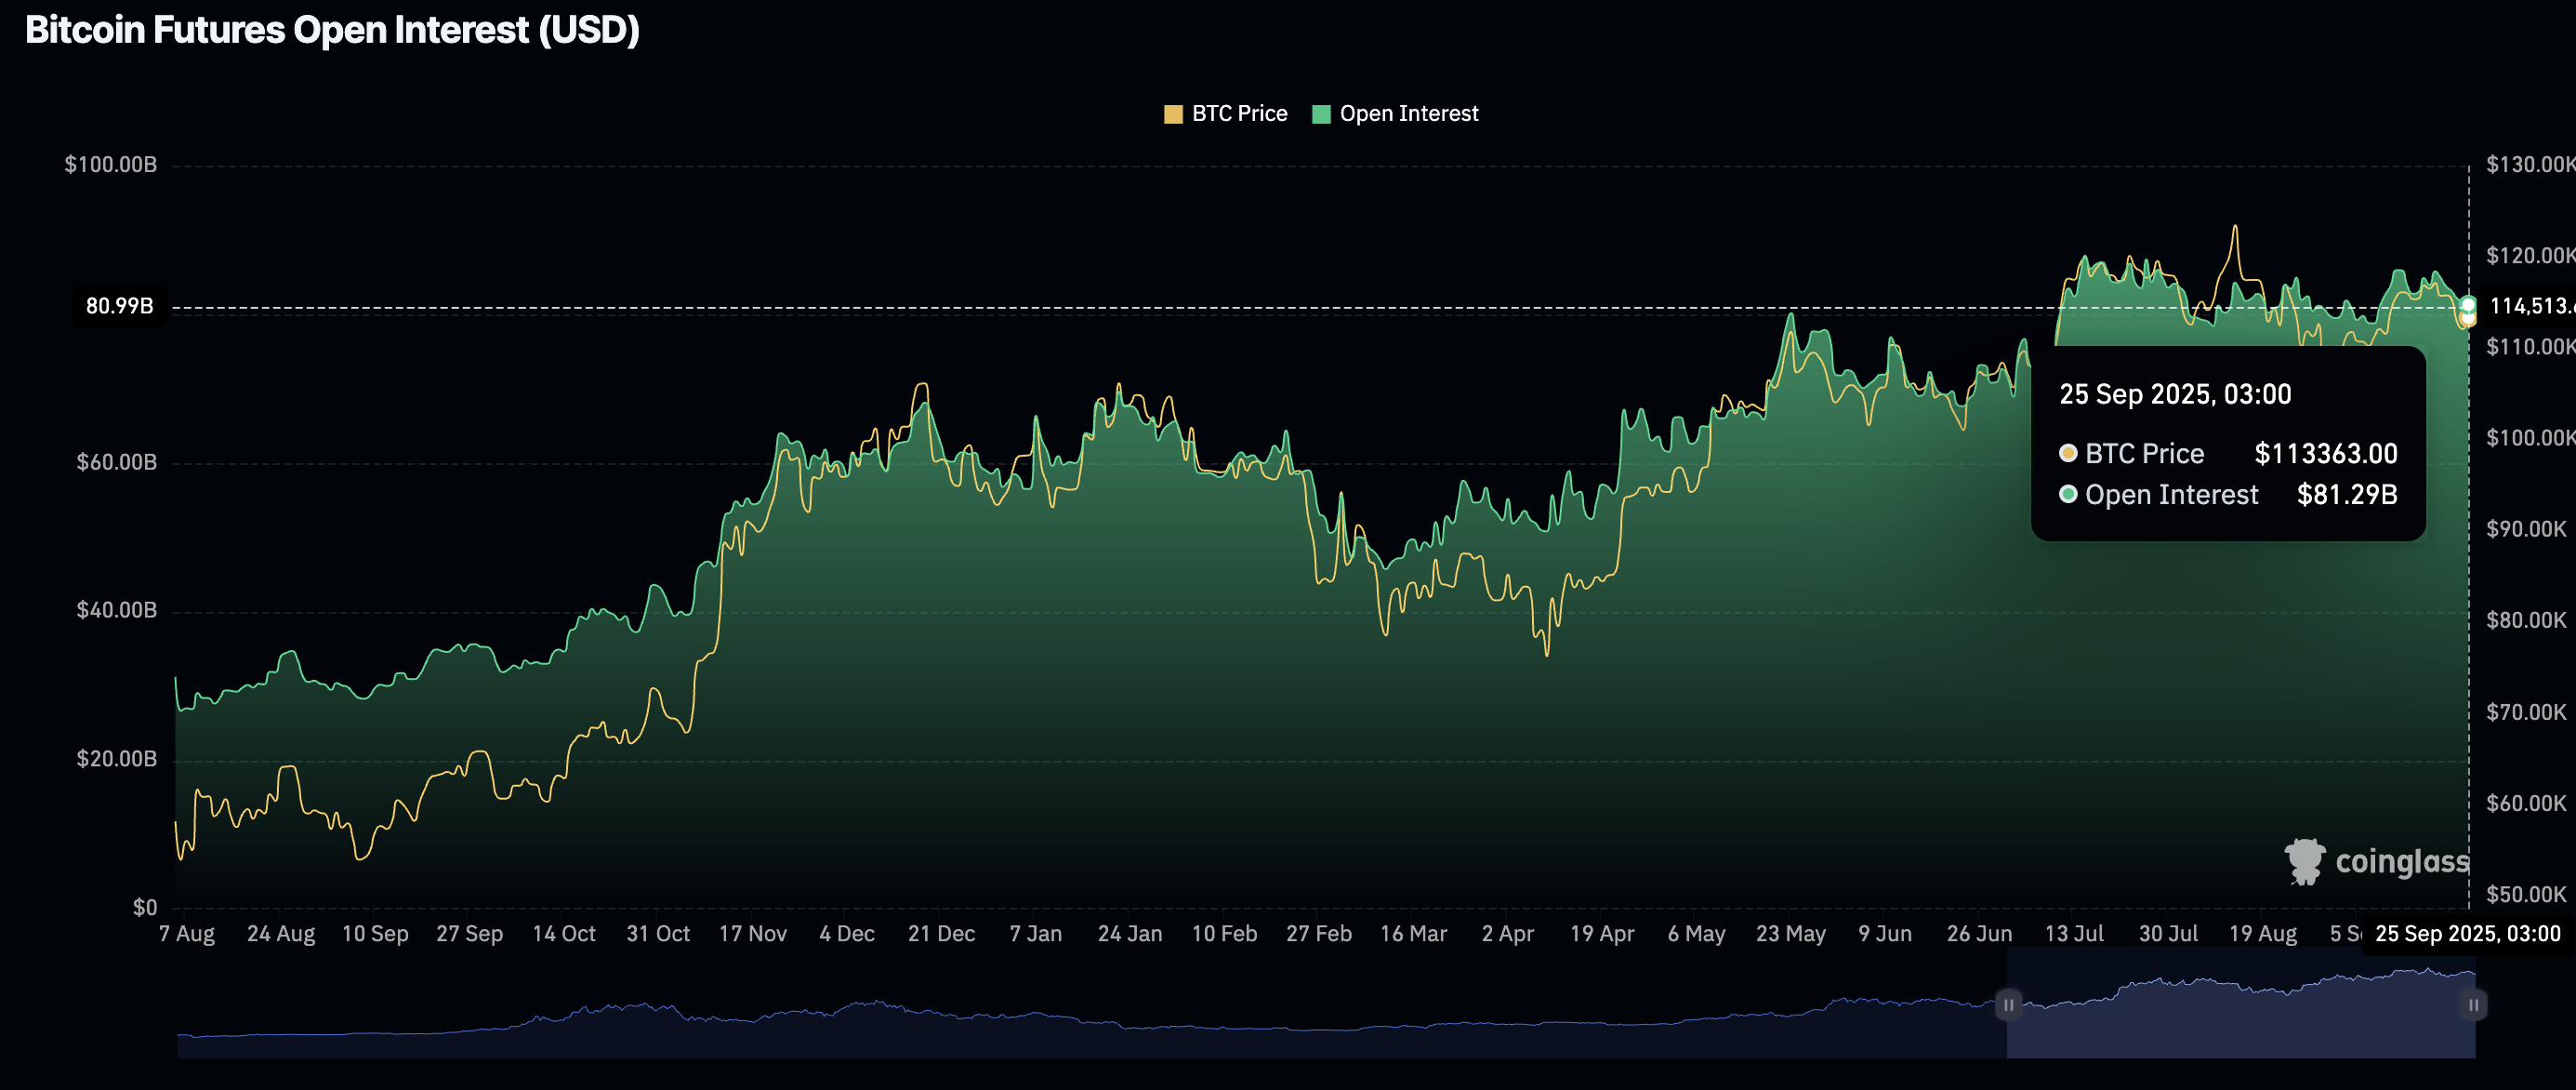
Bitcoin Futures Open Interest | Source: CoinGlass
Chart of the day: Can Bitcoin bulls hold key support?
Bitcoin trades significantly below key moving averages on the 4-hour chart, which have confirmed a Death Cross pattern. The 50-period Exponential Moving Average (EMA) crossed below the 100-period EMA on Thursday and is likely to extend the decline beneath the 200-period EMA in upcoming sessions, underpinning the prevailing risk-off sentiment.
A rising wedge pattern on the same 4-hour chart projects that Bitcoin could extend the decline below the $110,000 level before regaining bullish momentum. This would result in a 5% drop below the wedge pattern, as shown on the chart below.
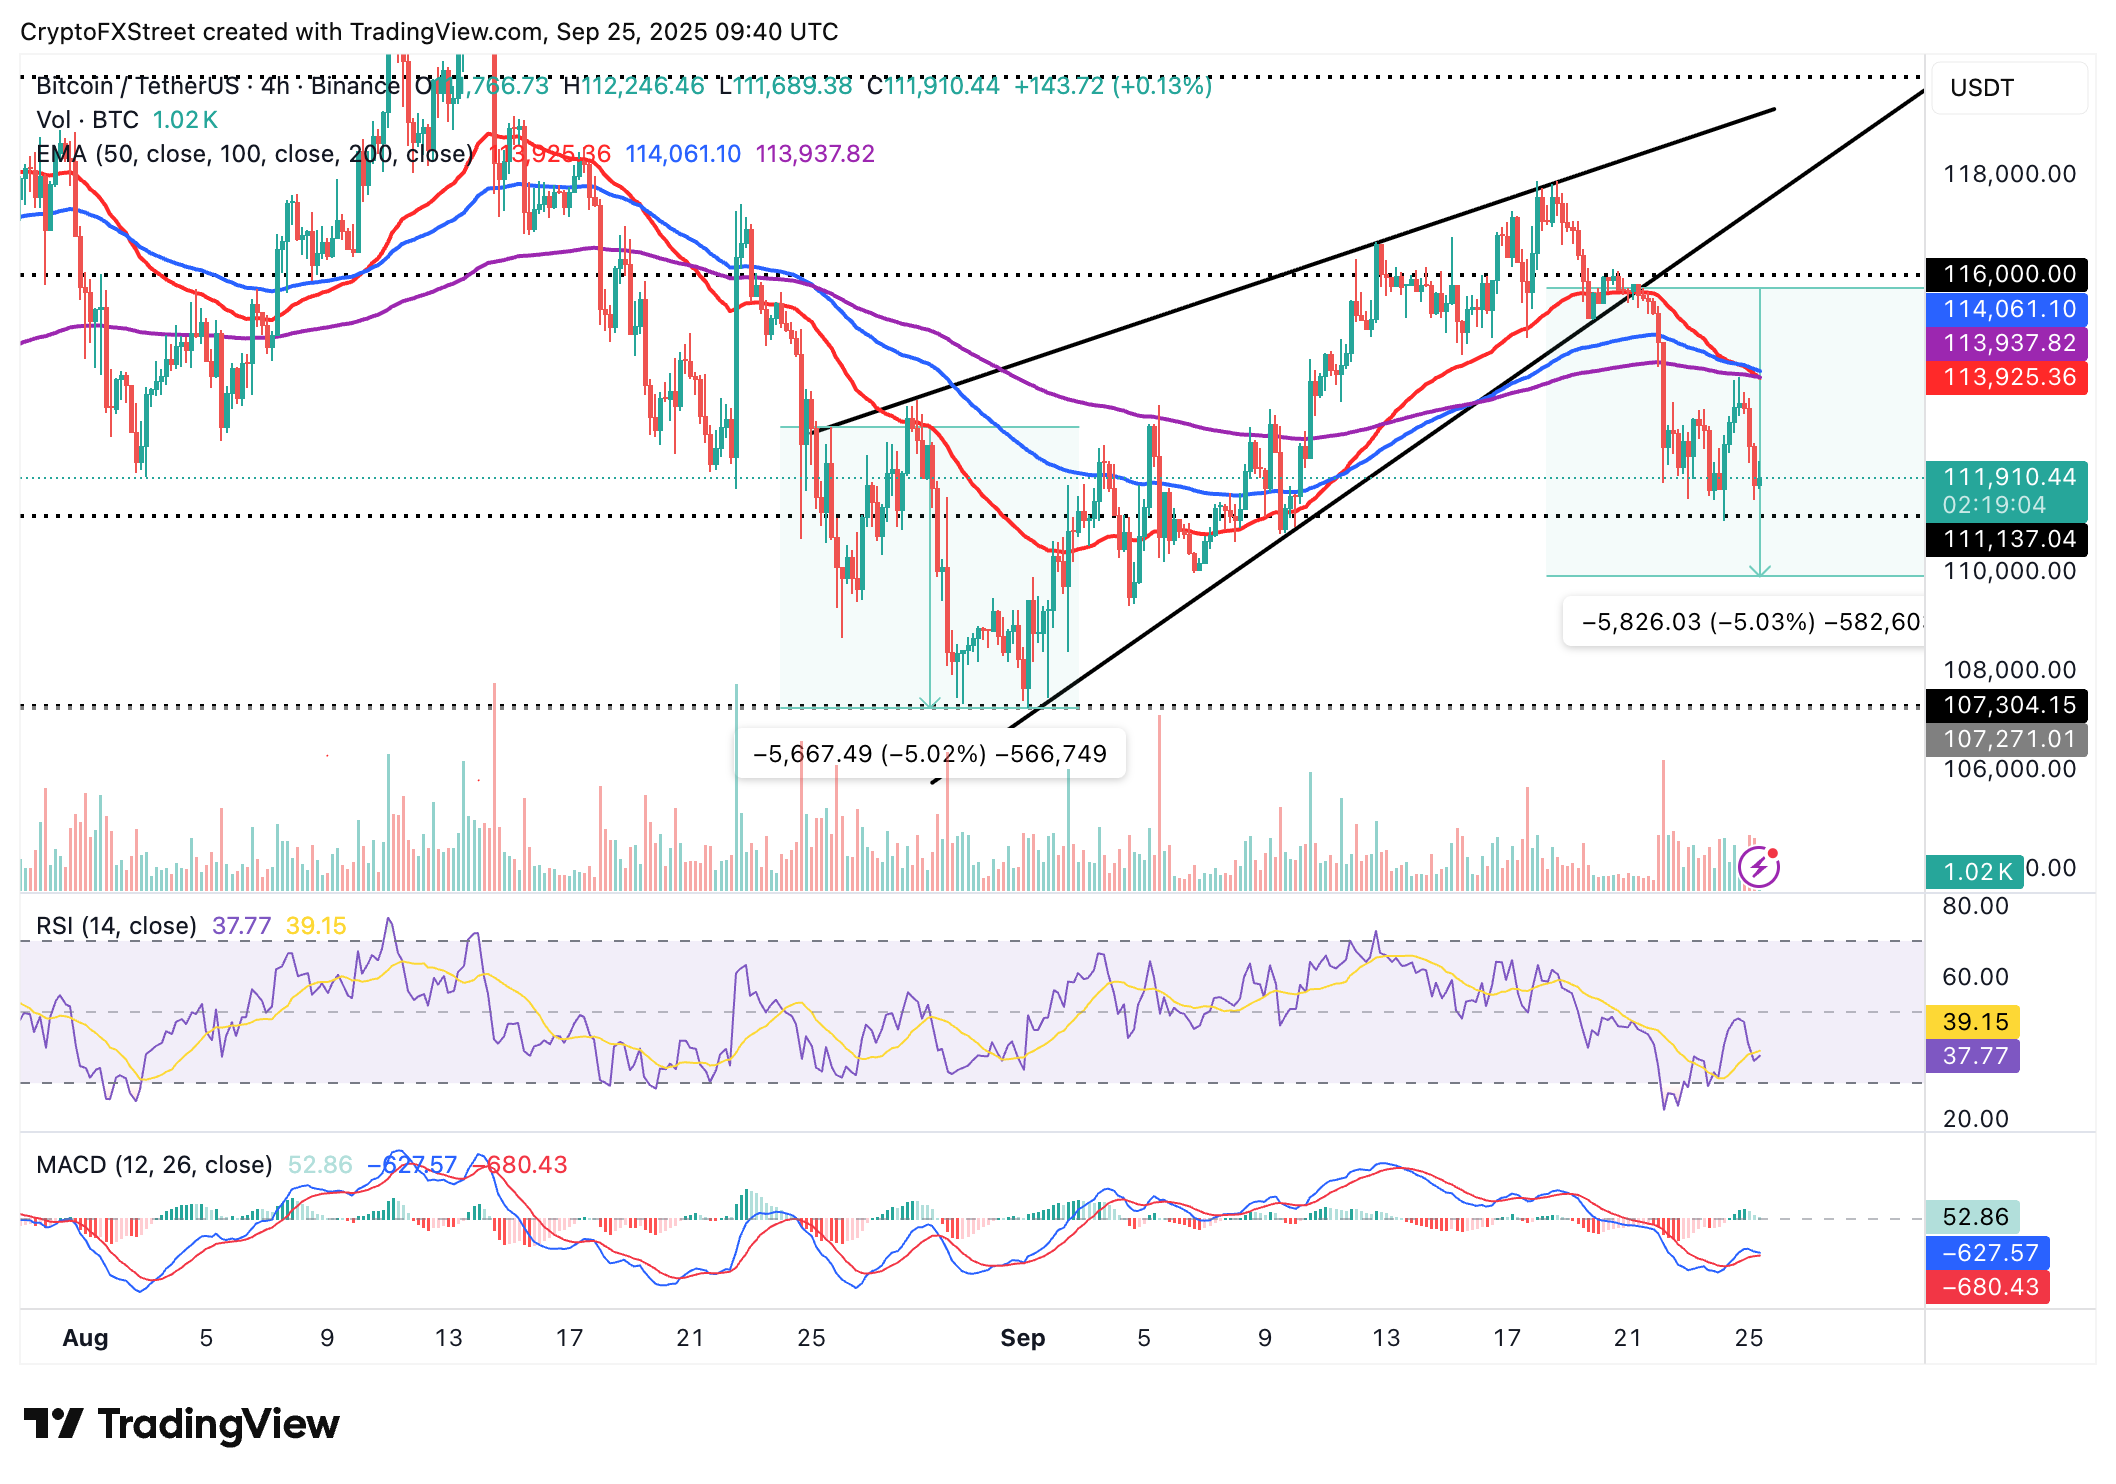
BTC/USD 4-hour chart
Still, traders should temper their bearish expectations, considering the Relative Strength Index (RSI) at 37 on the 4-hour chart has begun to stabilize, which could be followed by a reversal toward the midline. Higher RSI readings indicate that bullish momentum is building, thereby supporting a potential recovery.
Altcoins update: Ethereum and XRP uphold key support levels
Ethereum tested the $4,000 short-term support earlier on Thursday, extending the correction from the beginning of the week. The smart contracts token also holds below key moving averages, including the 50-period, 100-period, and 200-period EMAs on the 4-hour chart, underscoring negative sentiment in the broader cryptocurrency market.
Two Death Cross patterns on the same 4-hour chart back the downtrend, as investors sit on the sidelines, anticipating further losses below $4,000. The 50-period EMA crossed below the 100-period EMA on Monday and extended the decline below the 200-period EMA on Wednesday, reinforcing the bearish grip.
If bears breach the $4,000 short-term support level, the Ethereum price could extend the down leg toward the next round-number demand area around $3,800.
Still, traders should temper their bearish expectations, considering the RSI has steadied at 24 amid oversold conditions, which often precede bullish trend reversals.
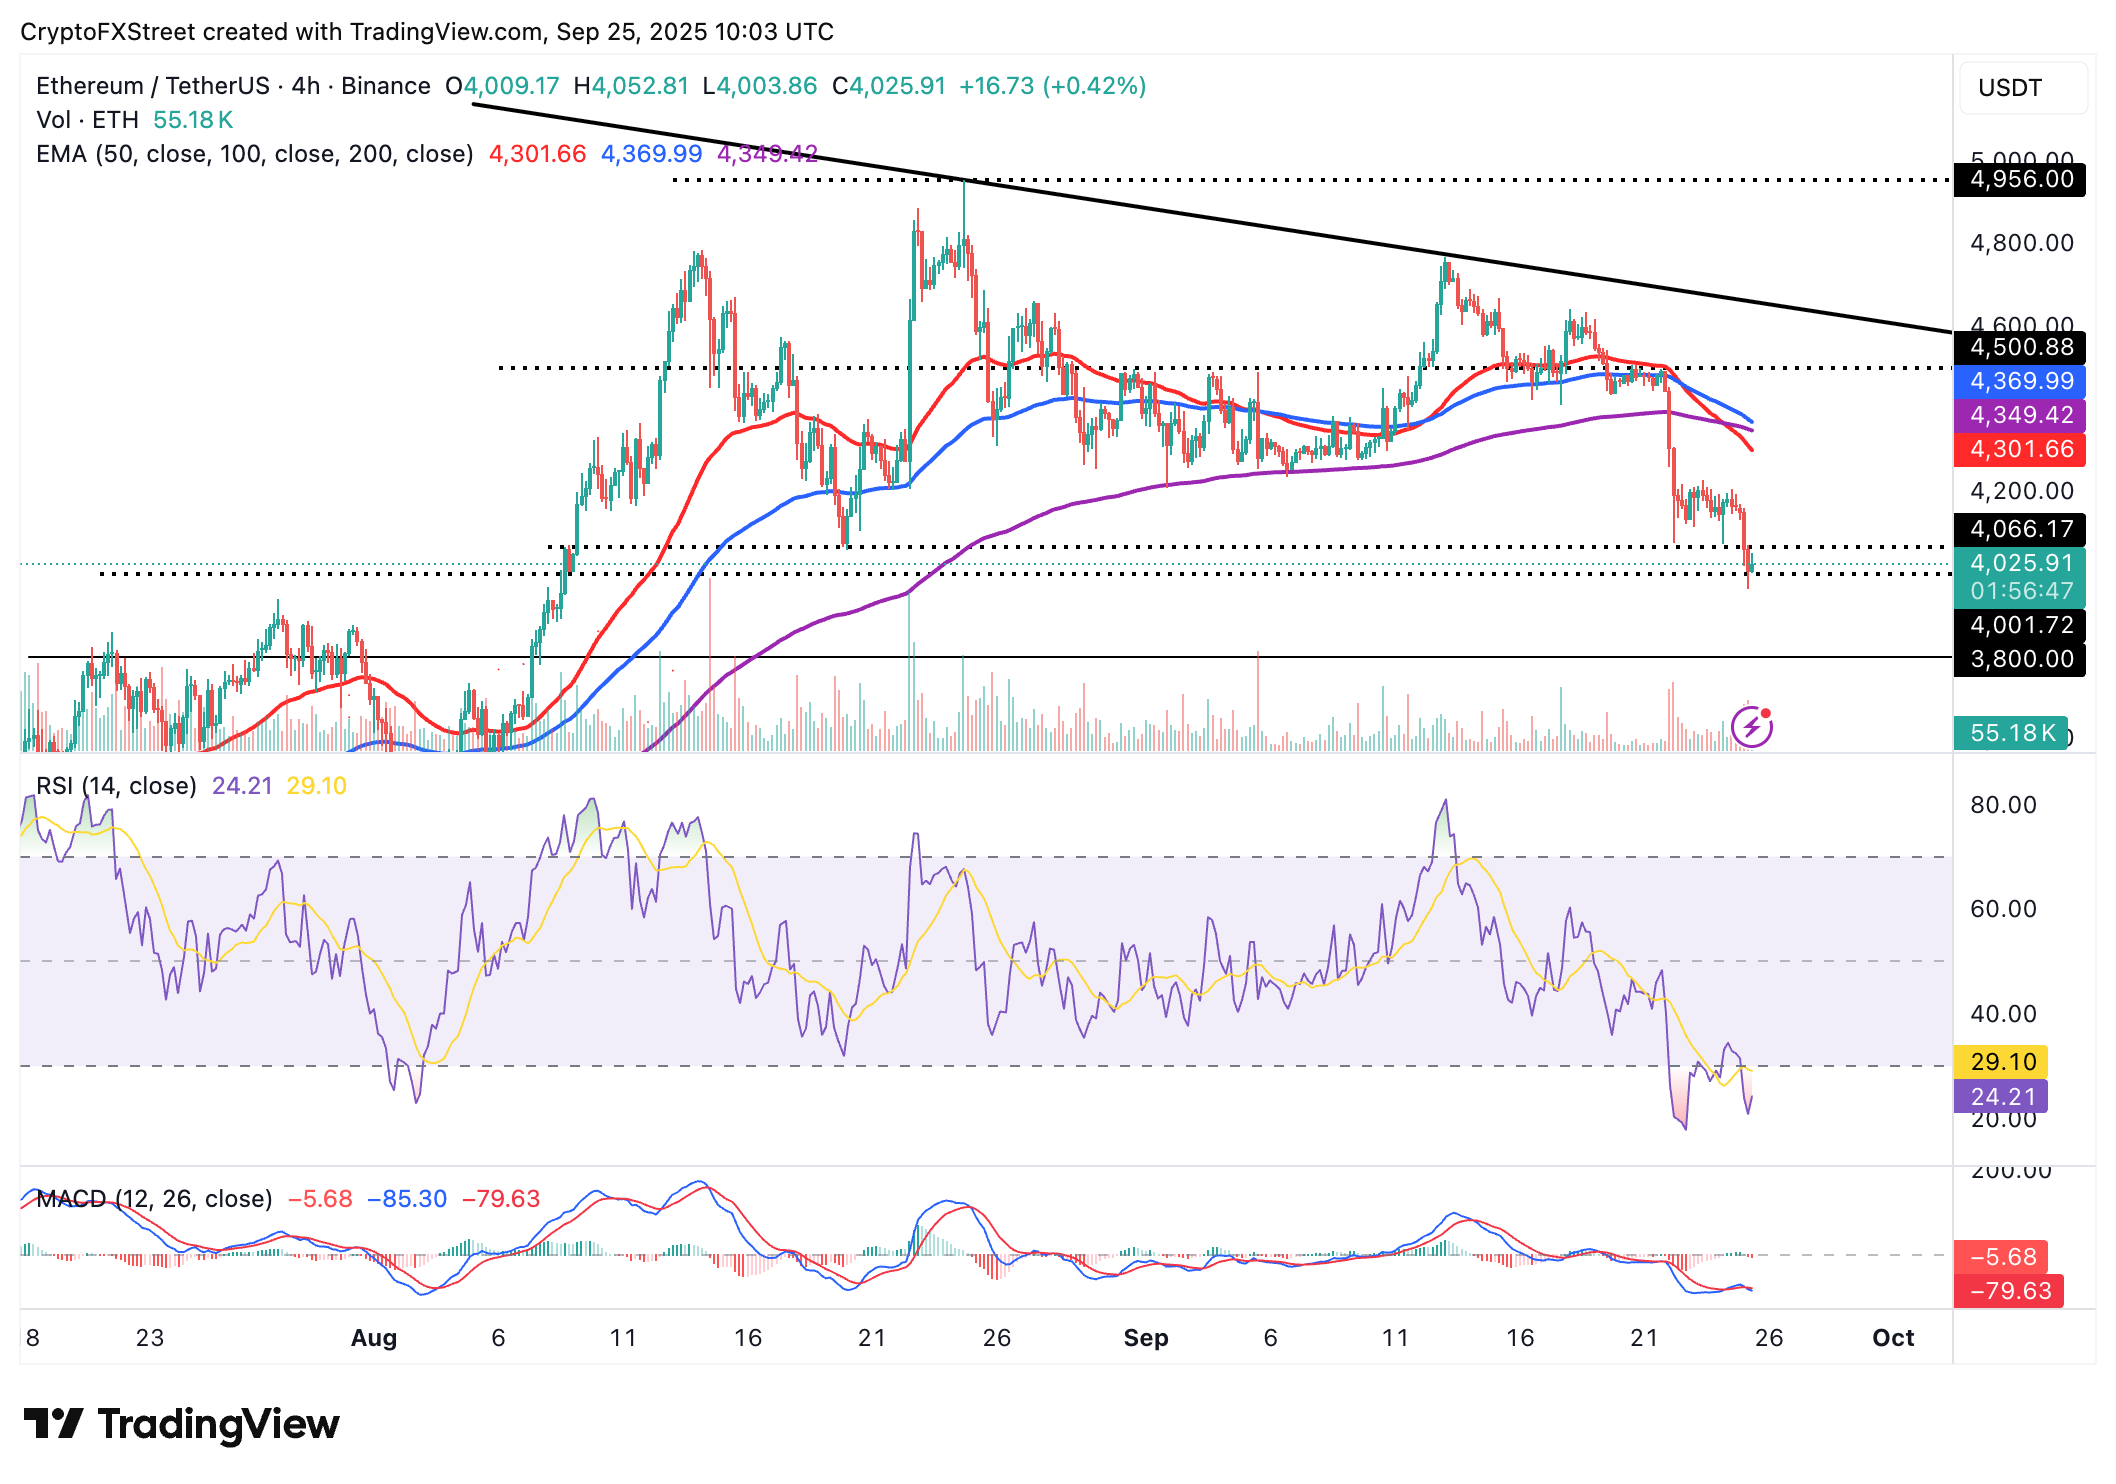
ETH/USD 4-hour chart
As for XRP, bulls are delicately holding onto support at $2.83, provided by the 100-day EMA, after facing rejection at the 50-day EMA positioned at $2.83. Investors would anticipate another breakout attempt from the short-term support, but the downward-facing RSI on the daily chart could challenge the bullish outlook, leaving XRP vulnerable to further losses.
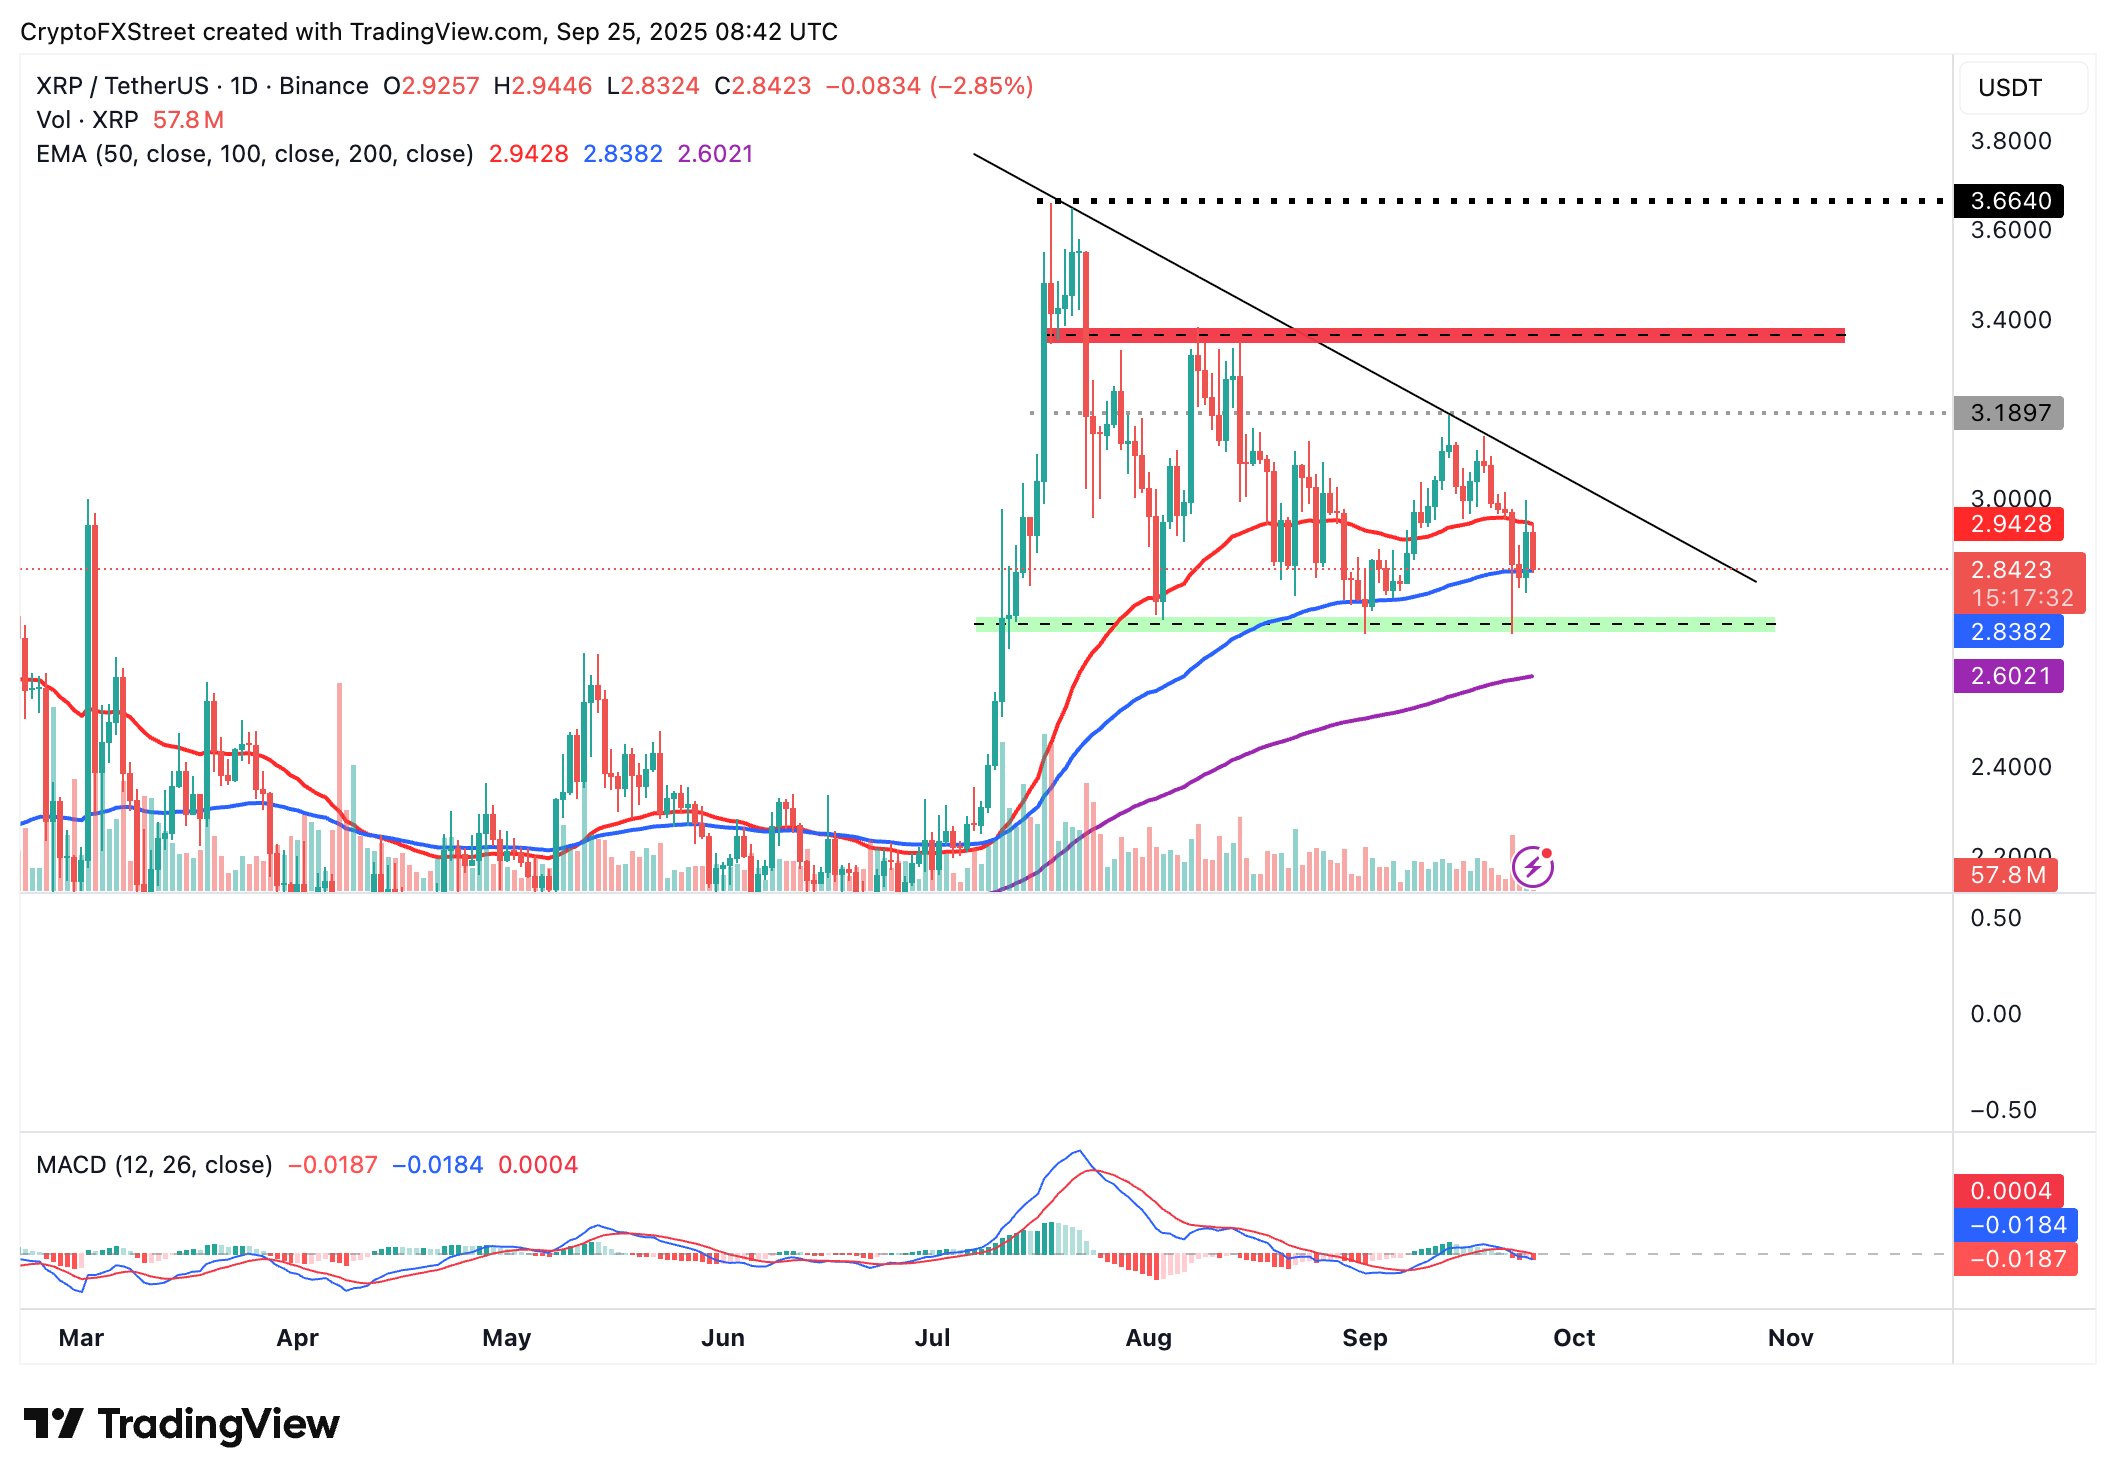
XRP/USD daily chart
Key areas of interest for traders are the demand level at $2.70, which was previously tested on Monday, and the 200-day EMA at $2.60. On the other hand, a successful break above the 50-day EMA at $2.94 would back the trend reversal. Still, risks could remain tilted downward until the XRP price breaks the overall downtrend marked by a descending trendline since late July.
Cryptocurrency prices FAQs
Token launches influence demand and adoption among market participants. Listings on crypto exchanges deepen the liquidity for an asset and add new participants to an asset’s network. This is typically bullish for a digital asset.
A hack is an event in which an attacker captures a large volume of the asset from a DeFi bridge or hot wallet of an exchange or any other crypto platform via exploits, bugs or other methods. The exploiter then transfers these tokens out of the exchange platforms to ultimately sell or swap the assets for other cryptocurrencies or stablecoins. Such events often involve an en masse panic triggering a sell-off in the affected assets.
Macroeconomic events like the US Federal Reserve’s decision on interest rates influence crypto assets mainly through the direct impact they have on the US Dollar. An increase in interest rate typically negatively influences Bitcoin and altcoin prices, and vice versa. If the US Dollar index declines, risk assets and associated leverage for trading gets cheaper, in turn driving crypto prices higher.
Halvings are typically considered bullish events as they slash the block reward in half for miners, constricting the supply of the asset. At consistent demand if the supply reduces, the asset’s price climbs.
Author

John Isige
FXStreet
John Isige is a seasoned cryptocurrency journalist and markets analyst committed to delivering high-quality, actionable insights tailored to traders, investors, and crypto enthusiasts. He enjoys deep dives into emerging Web3 tren


