Crypto market liquidations cross $650M: Ethena, Lido, Pump.fun lead losses
- Ethena edges lower within a rising, expanding channel, risking a potential breakdown.
- Lido extends losses from Sunday as the RSI flashes a bearish divergence.
- Pump.fun advances a downcycle within a declining wedge, eyeing steeper levels.

Ethena (ENA), Lido (LDO), and Pump.fun (PUMP) start the week under pressure, leading the cryptocurrency market losses over the last 24 hours. The altcoins display room for further correction, as the selling pressure increases.
The cryptocurrency market has recorded a total liquidation of $666 million as overhead supply increases. The $502 million in long liquidations, compared to $164 million in short liquidations, highlights the widespread forced exit of bullish positions.
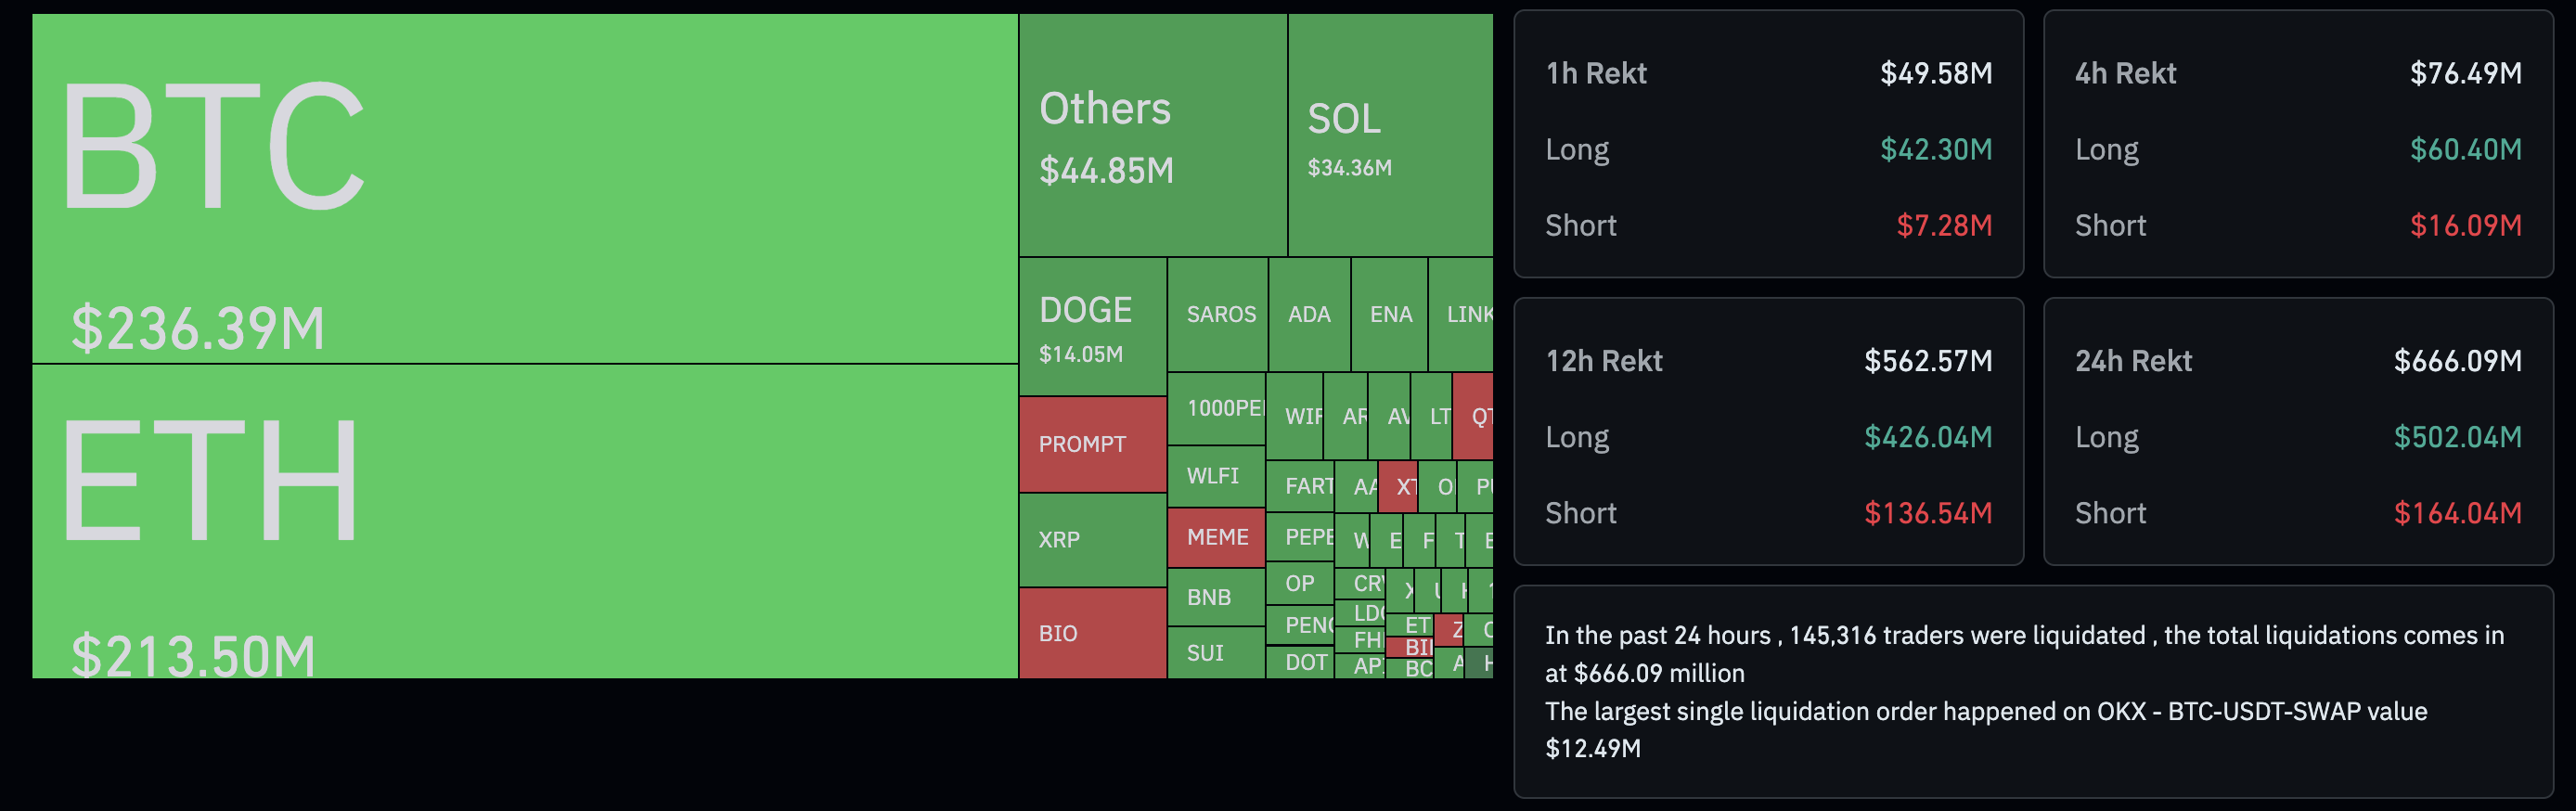
Crypto Market Liquidations. Source: Coinglass
Ethena extends the pullback under pressure
Ethena trades at $0.6881 at the time of writing on Monday, having stepped higher from its recent low of $0.6744. The synthetic dollar token trends lower for the third consecutive day, eyeing a support trendline formed by connecting the August 2 and August 21 lows, near $0.6500.
A potential daily close below this level could extend the decline to the 50-day Exponential Moving Average (EMA) at $0.5876, followed by the $0.5122 support marked by the August 2 low.
The Moving Average Convergence Divergence (MACD) and its signal line are on a downward slope after the sell signal (crossover) was generated on August 15. A successive trend of red histogram bars below the zero signal indicates the rise in bearish momentum.
The Relative Strength Index (RSI) at 53 floats above the midpoint as buying pressure wanes. A dip below this level would trigger a spike in selling pressure, increasing the pattern breakdown risk.
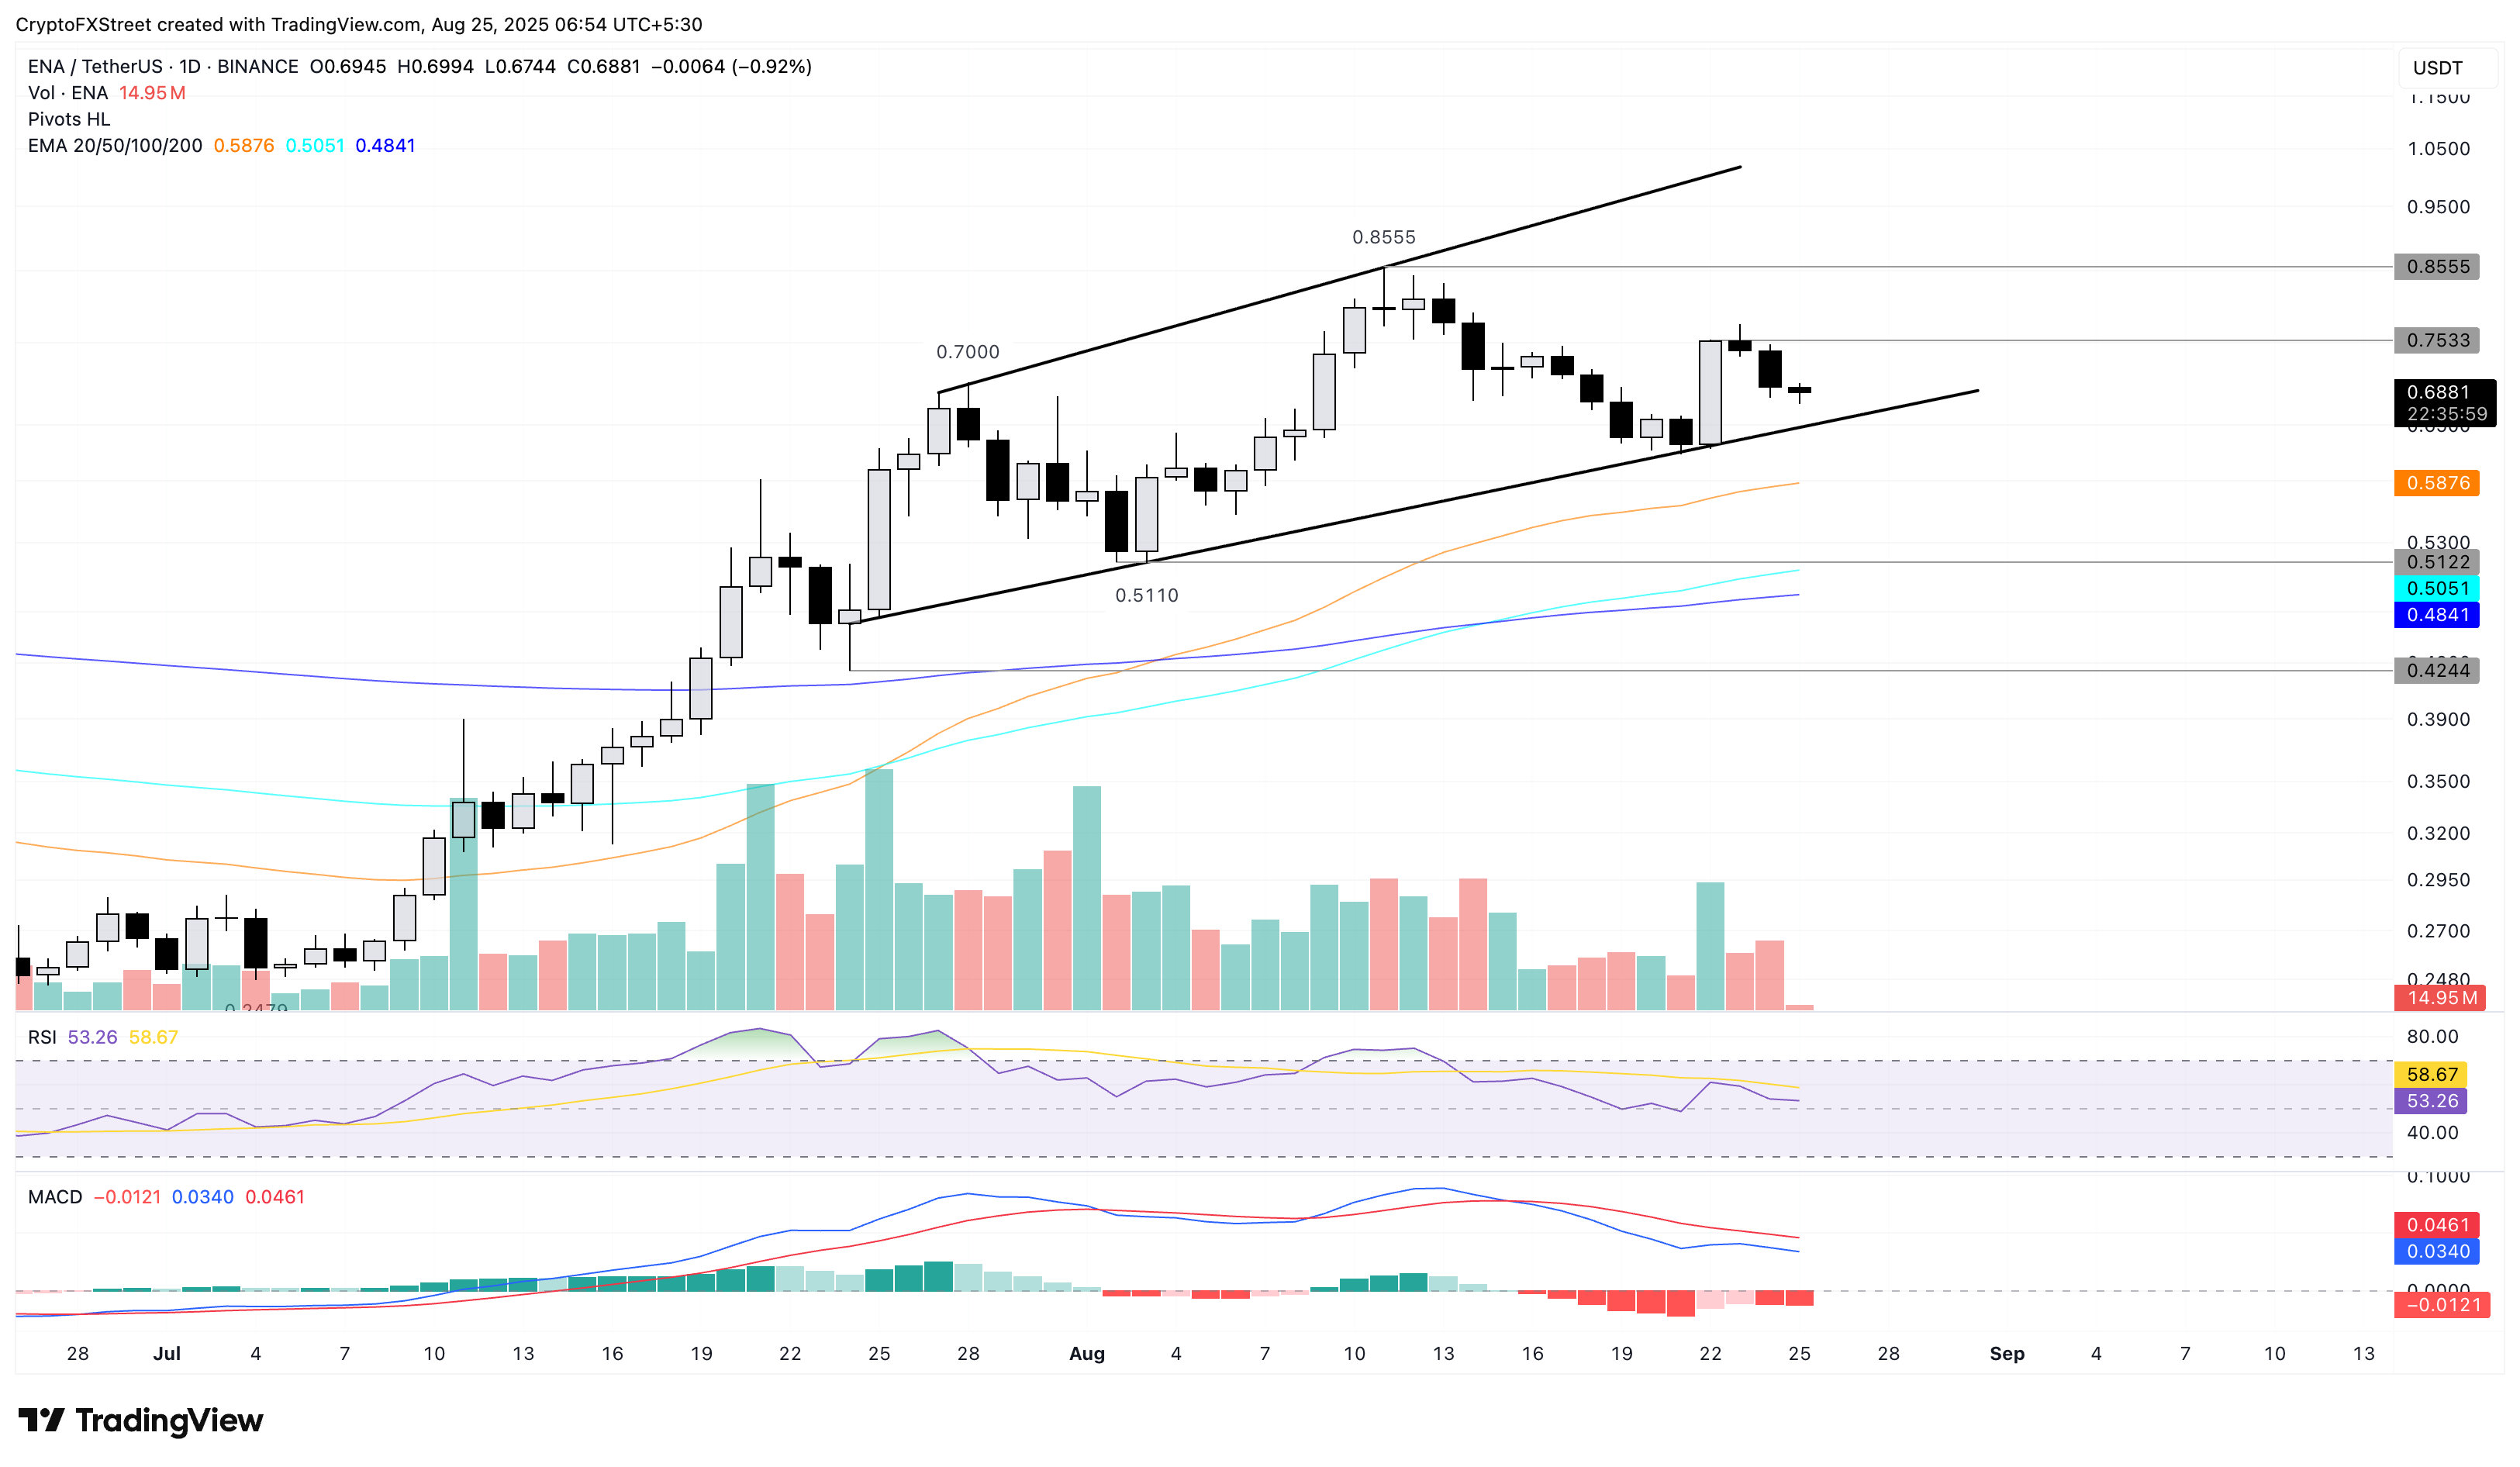
ENA/USDT daily price chart.
On the contrary, if ENA bounces off the support trendline or marks a decisive close above the $0.7533 (Friday close), it could extend the rally to $0.8555 peak from August 11.
Lido is at risk of a double top reversal
Lido edges lower by 1% at press time on Monday, extending the 6.27% loss from Sunday. The Liquid staking governance token warns of a double top pattern, formed by the peaks of August 12 and August 22.
The RSI indicator on the daily chart forms lower high peaks coinciding with the potential double top, flashing a bearish divergence. Currently, the RSI stands at 58, moving closer to the midpoint as buying pressure wanes.
A potential close below the $1.2250 support level, marked by the August 10 low, would release the trapped momentum on the downside, potentially testing the 200-day EMA at $1.1046.
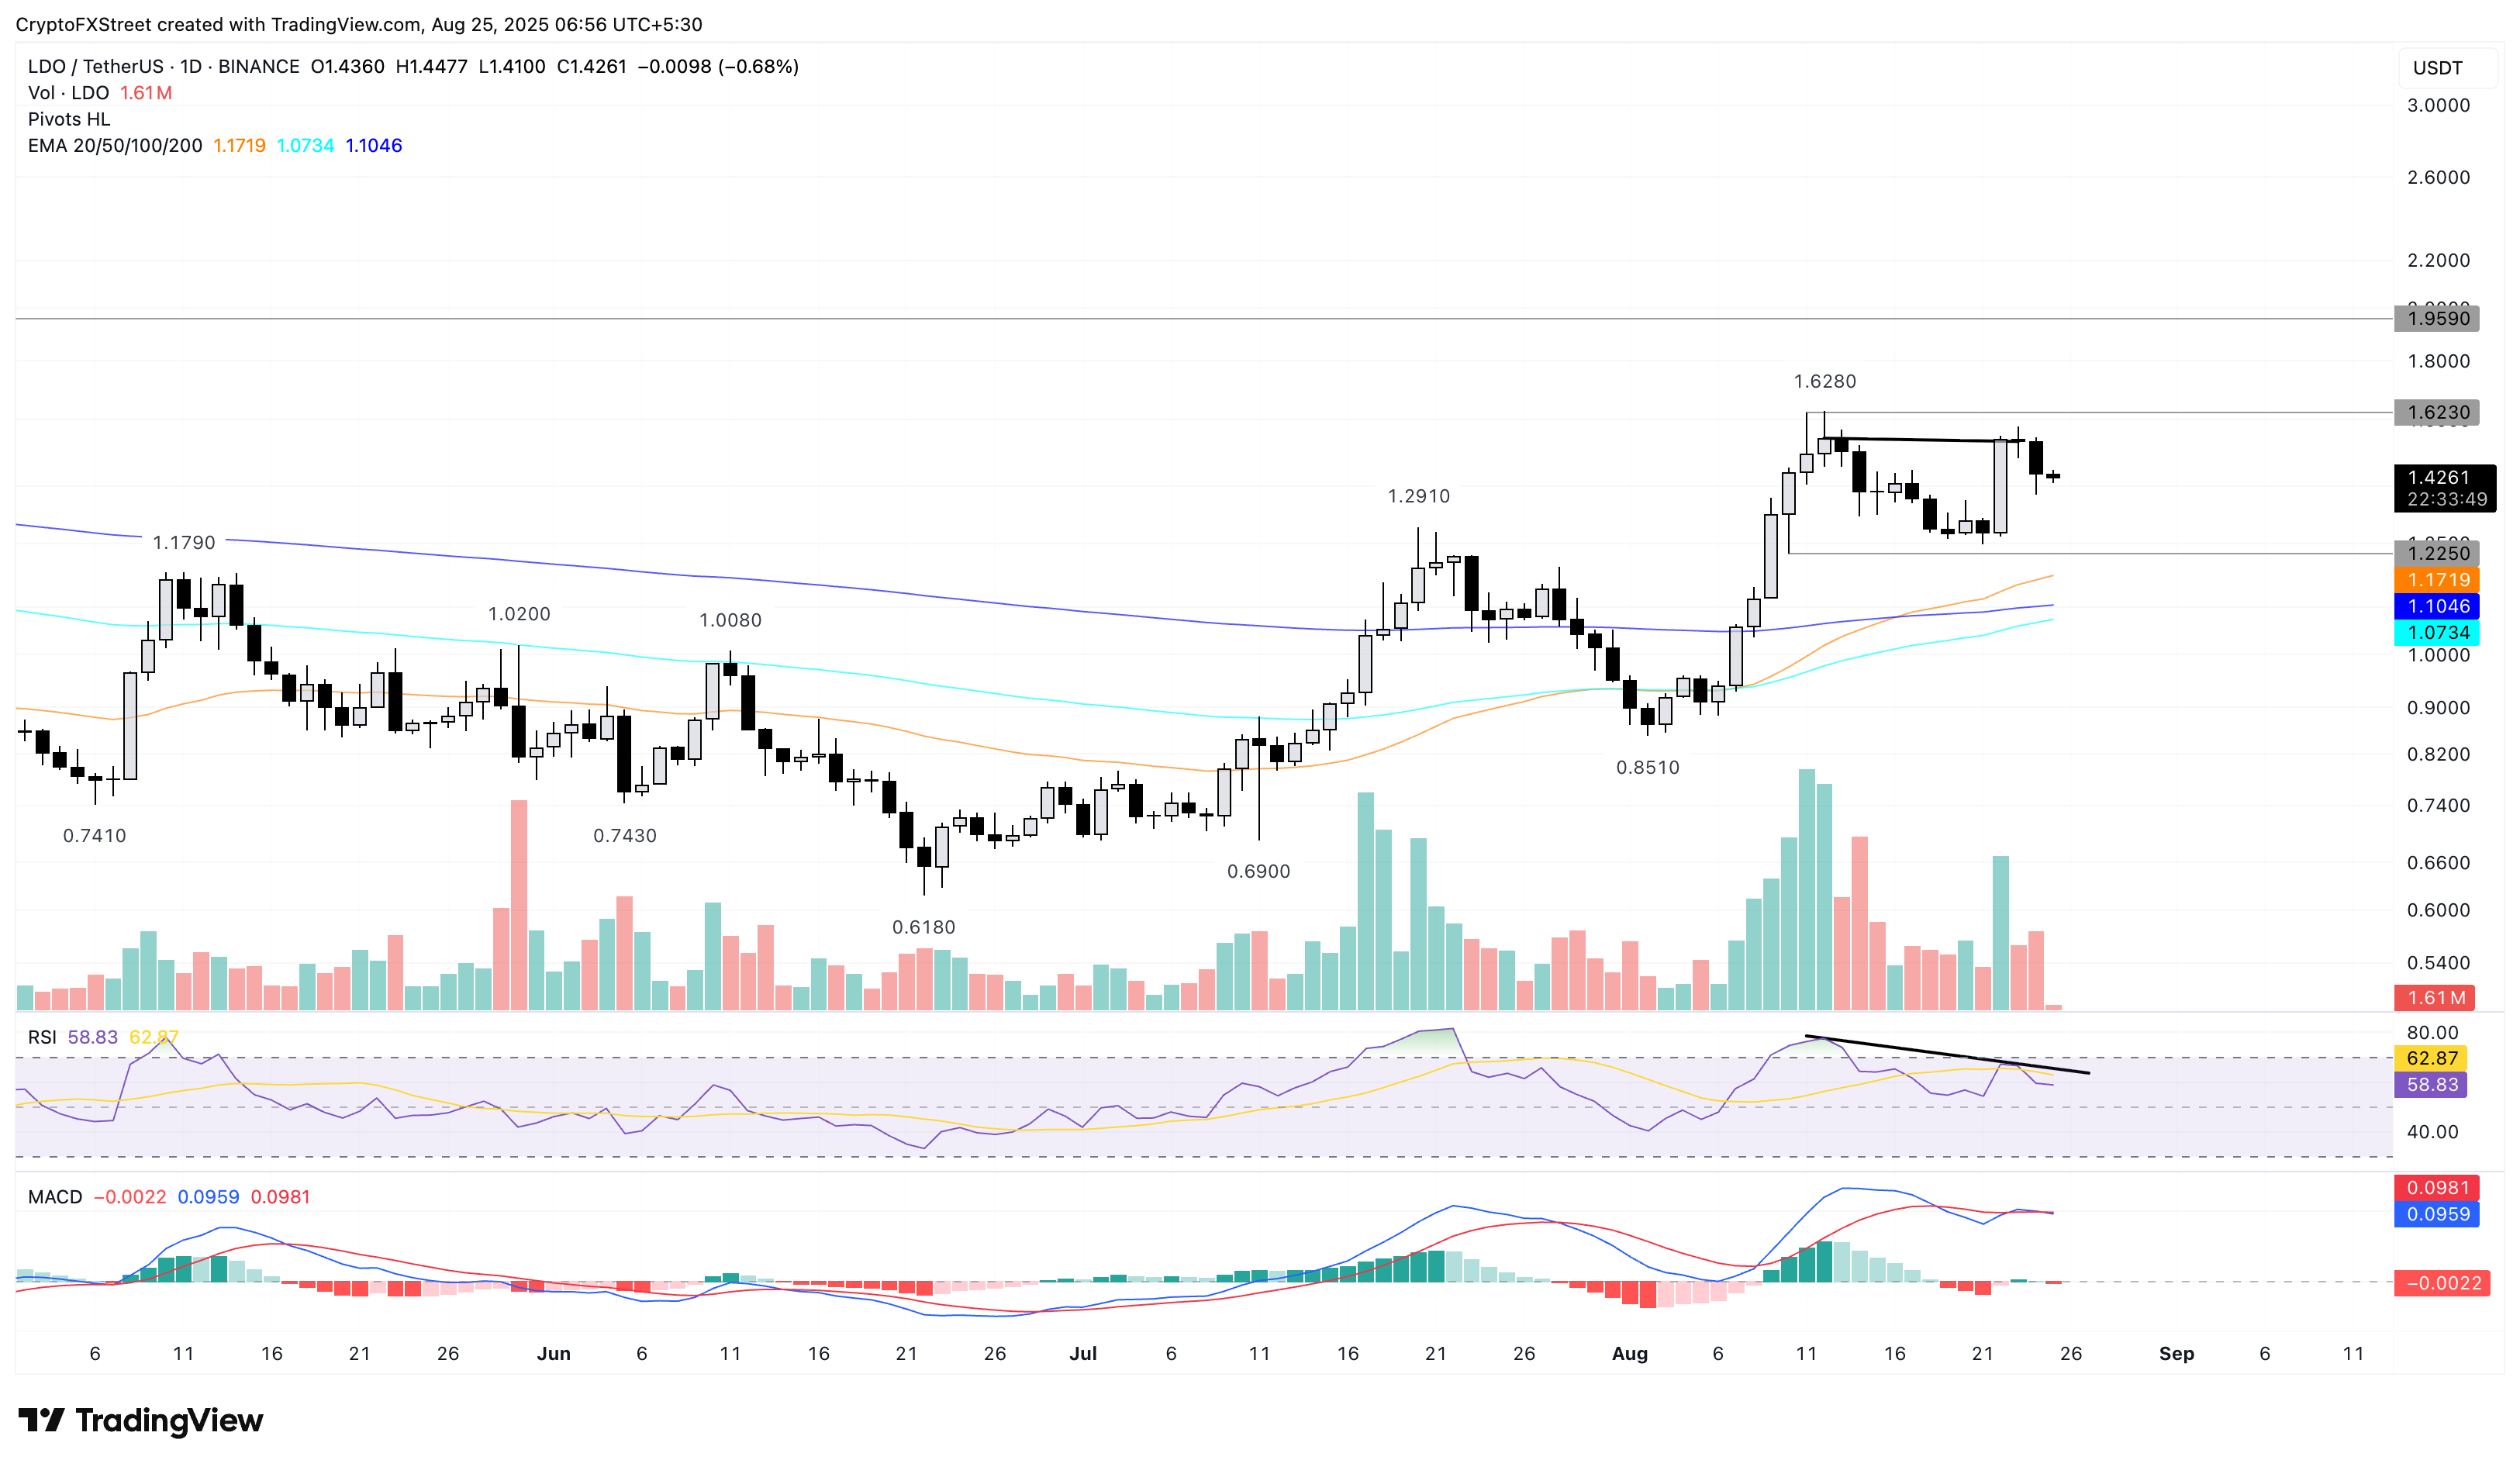
LDO/USDT daily price chart.
On the flip side, to reinforce an uptrend, LDO should surpass the $1.6230 high from August 12. This breakout rally could stretch the rally to $1.9590, marked by the February 17 peak.
Pump.Fun risks further losses in a wedge pattern
Pump.fun edges lower within a falling wedge pattern on the 4-hour chart (shared below), extending the 7% drop from Sunday. The meme coin launch token trades at $0.002886 at press time on Monday, eyeing the $0.002744 support or the August 19 low.
Despite the near-term support, the downcycle within the wedge pattern could test the lower boundary line near $0.002579.
The RSI reads 40 on the 4-hour chart, declining towards the oversold zone as selling pressure grows. Additionally, the MACD and its signal line maintain a declining trend after triggering the August 24 sell signal.
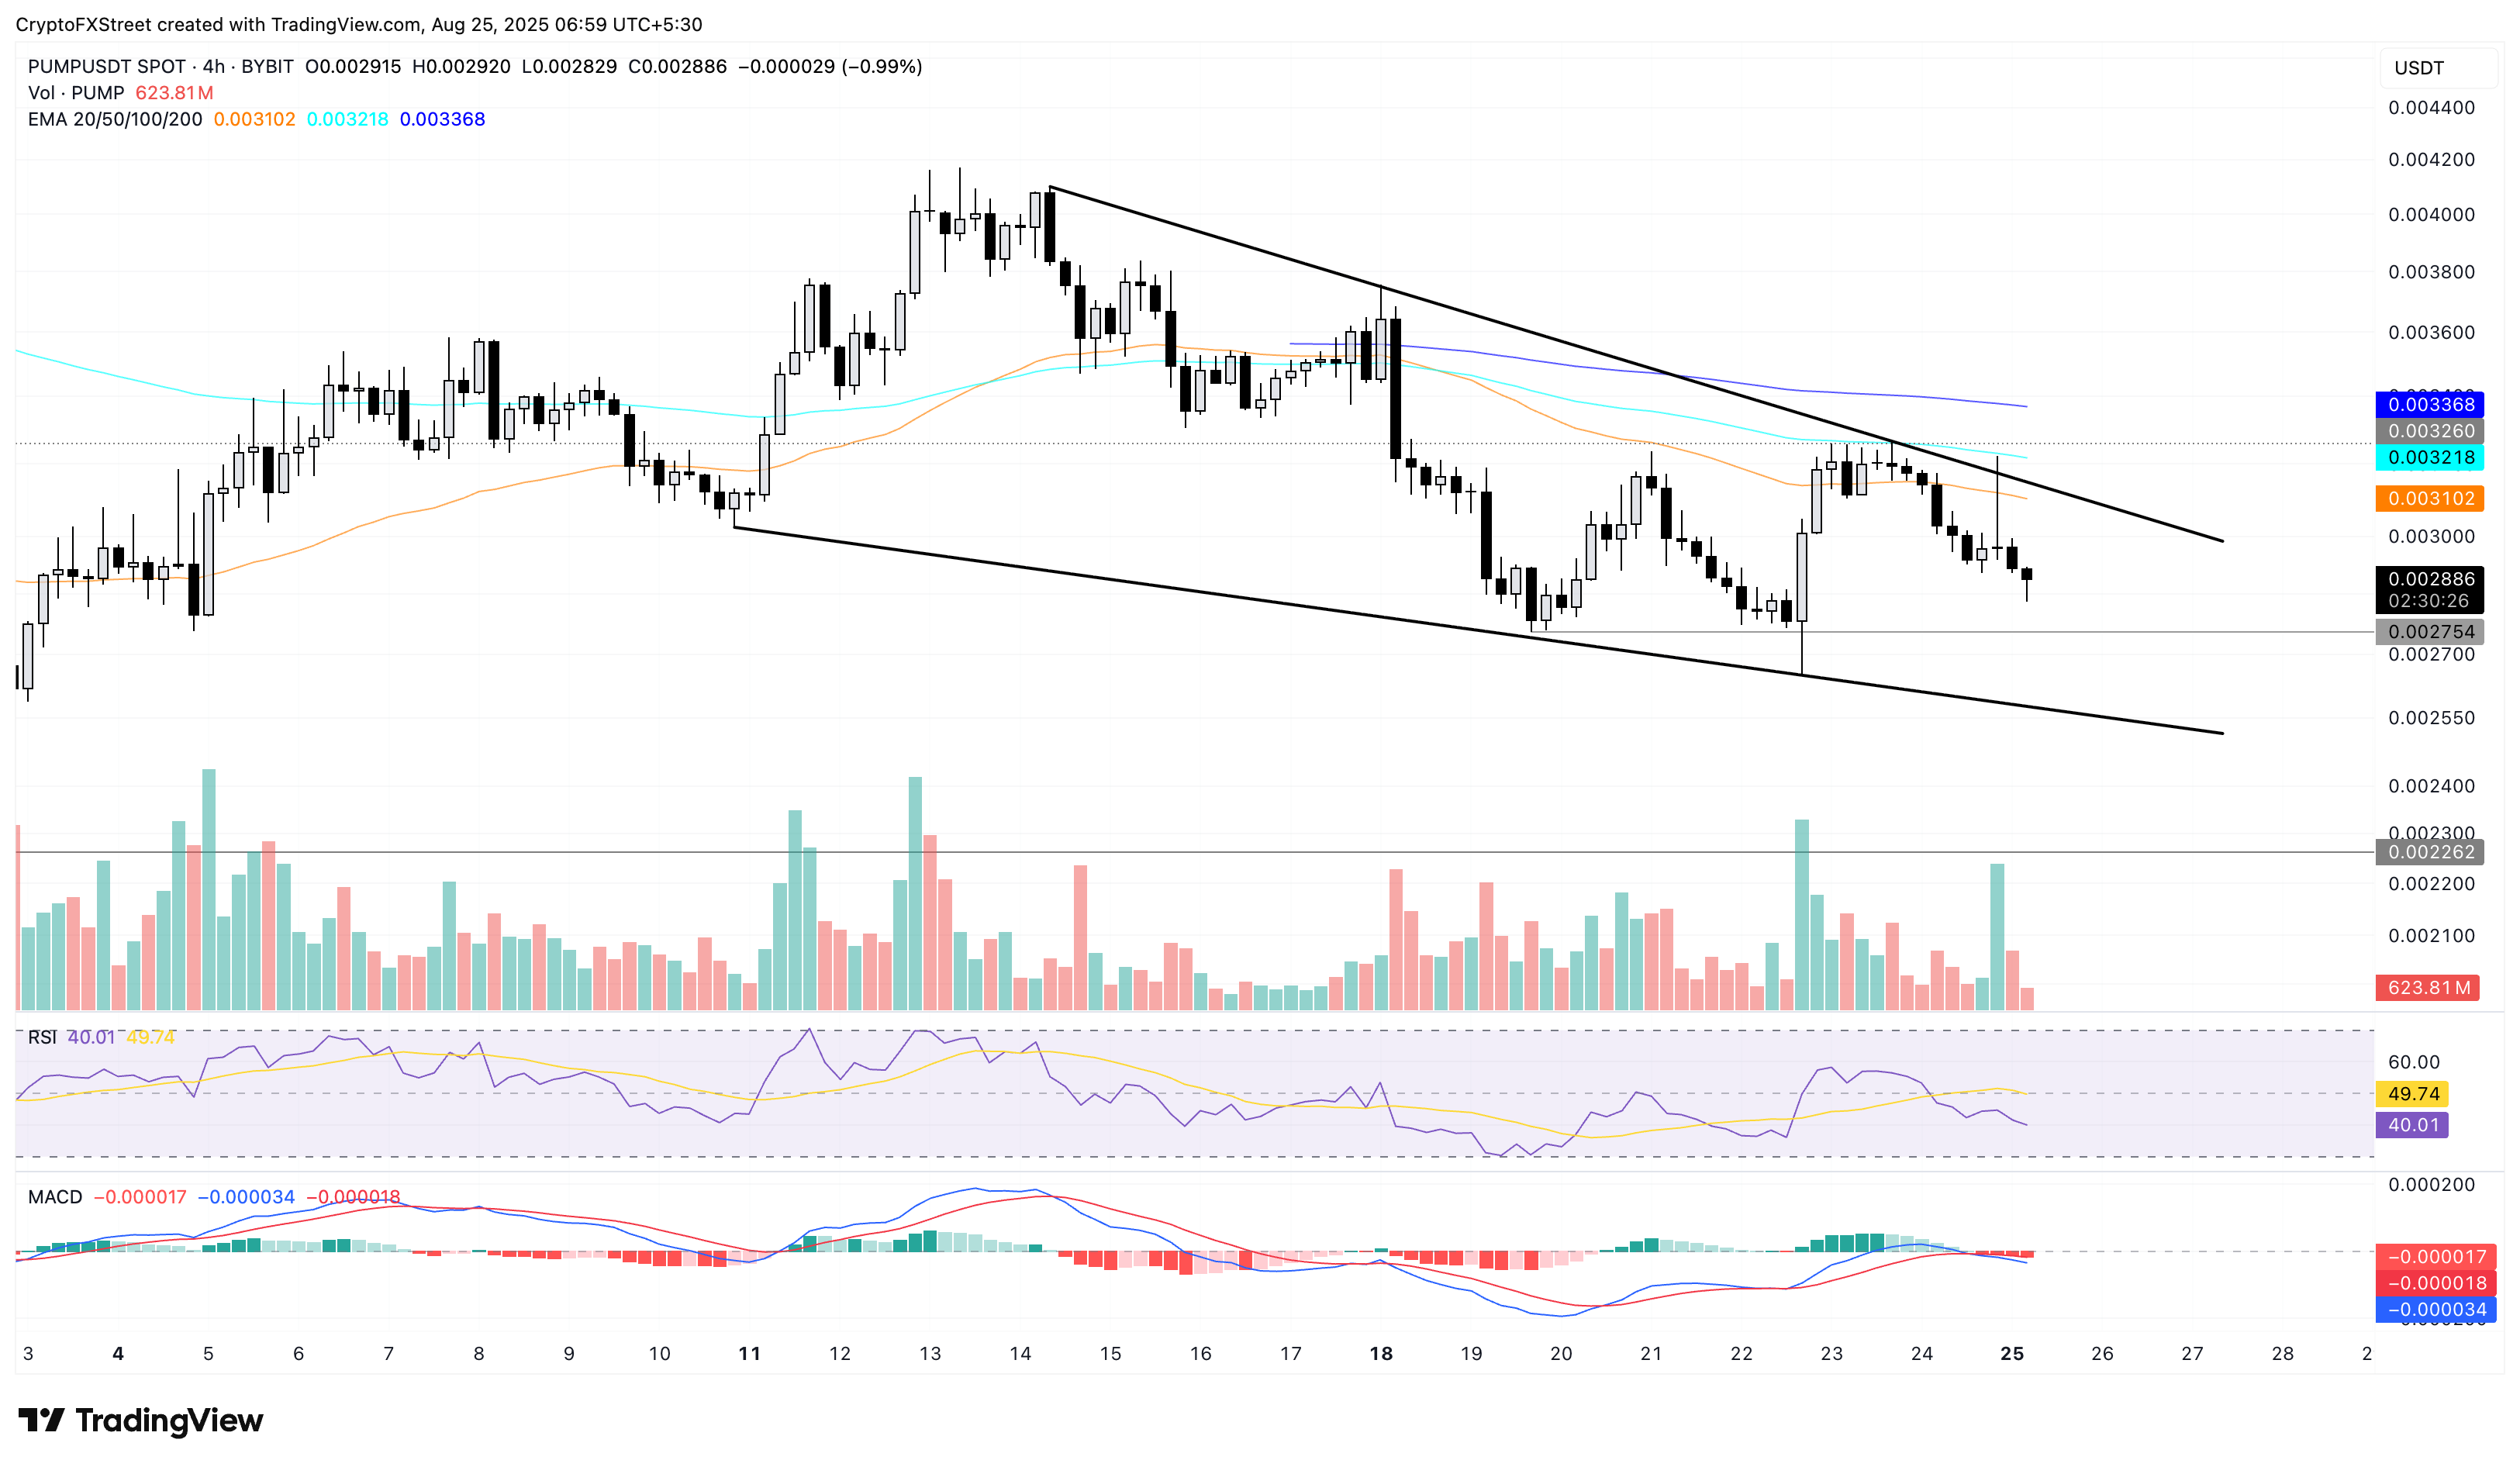
PUMP/USDT daily price chart.
On the flip side, if PUMP reverses from the support level, it could test the 50-period EMA at $0.003102, moving near the wedge pattern’s upper boundary line.
Author

Vishal Dixit
FXStreet
Vishal Dixit holds a B.Sc. in Chemistry from Wilson College but found his true calling in the world of crypto.




