Crypto Gainers: Pyth Network rallies with live US GDP data on-chain, Pump.fun, and POL follow
- Pyth Network surged 99% on Thursday as the price layer integrated US GDP data on-chain.
- Pump.fun bounces back as the supply shock after a $10 million buyback initiative from last week takes effect.
- POL rebounds as a Philippine senator demands that the national budget be recorded on-chain on Polygon.

Pyth Network (PYTH), Pump.fun (PUMP) and POL (POL) gained over 99% on Thursday, fueled by the US Gross Domestic Product (GDP) data integration. Pump. Fun and POL follow the gains underpinned by buyback programs and the demands of the on-chain Philippine national budget, respectively.
Pyth Network skyrockets with US GDP data integration
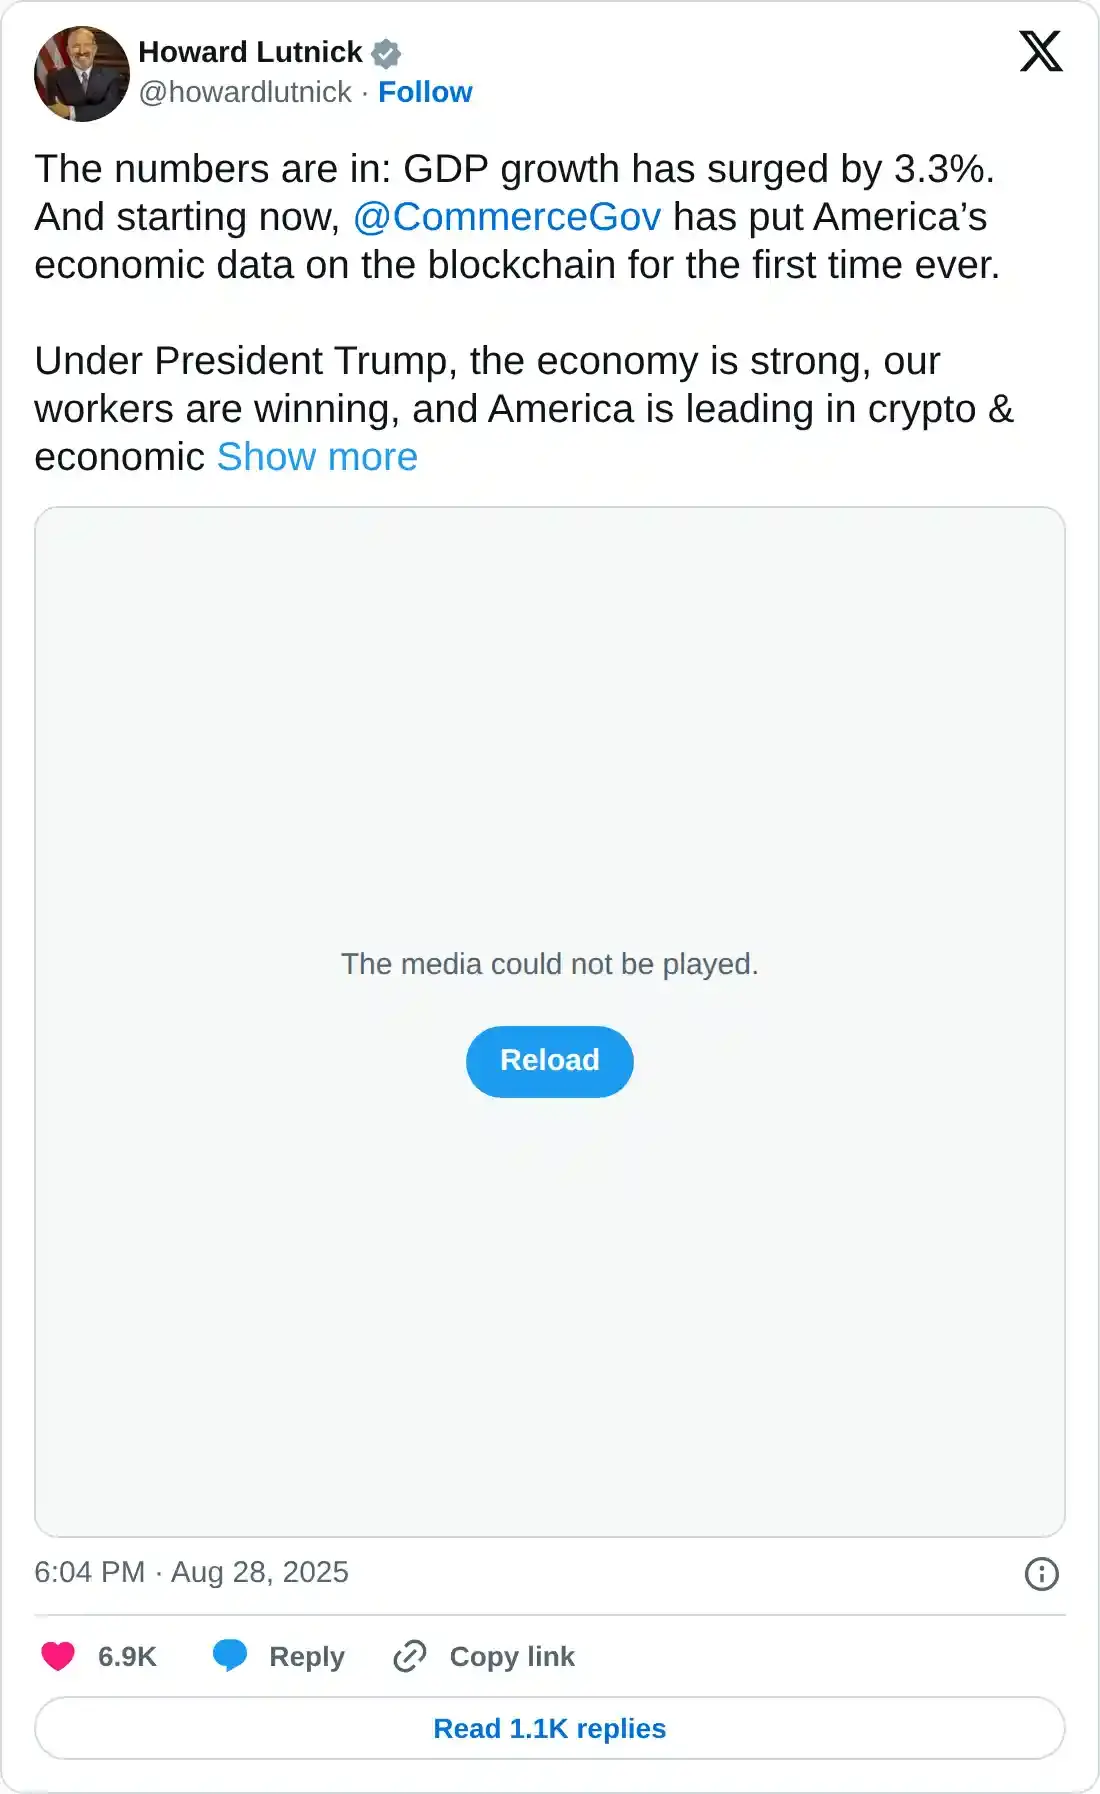
Pyth Network, the on-chain price layer, grabs the broader cryptocurrency market’s attention as the US GDP data goes live on-chain. Howard Lutnick, the US Secretary of Commerce, announced the shift to blockchain for transparency, showcasing strong economic confidence with a 3.3% rise in US GDP.
PYTH trades at $0.2314 at press time on Friday, targeting the 61.8% Fibonacci level at $0.2653, which is drawn from $0.5533 on December 3 to $0.0807 on June 22. A decisive push above this level could extend the rally to $0.3665, aligning with the 78.6% Fibonacci level.
The momentum indicators on the daily chart share a bullish bias as the Relative Strength Index (RSI) at 79 enters the overbought zone and the Moving Average Convergence Divergence (MACD) shoots up with its signal line.
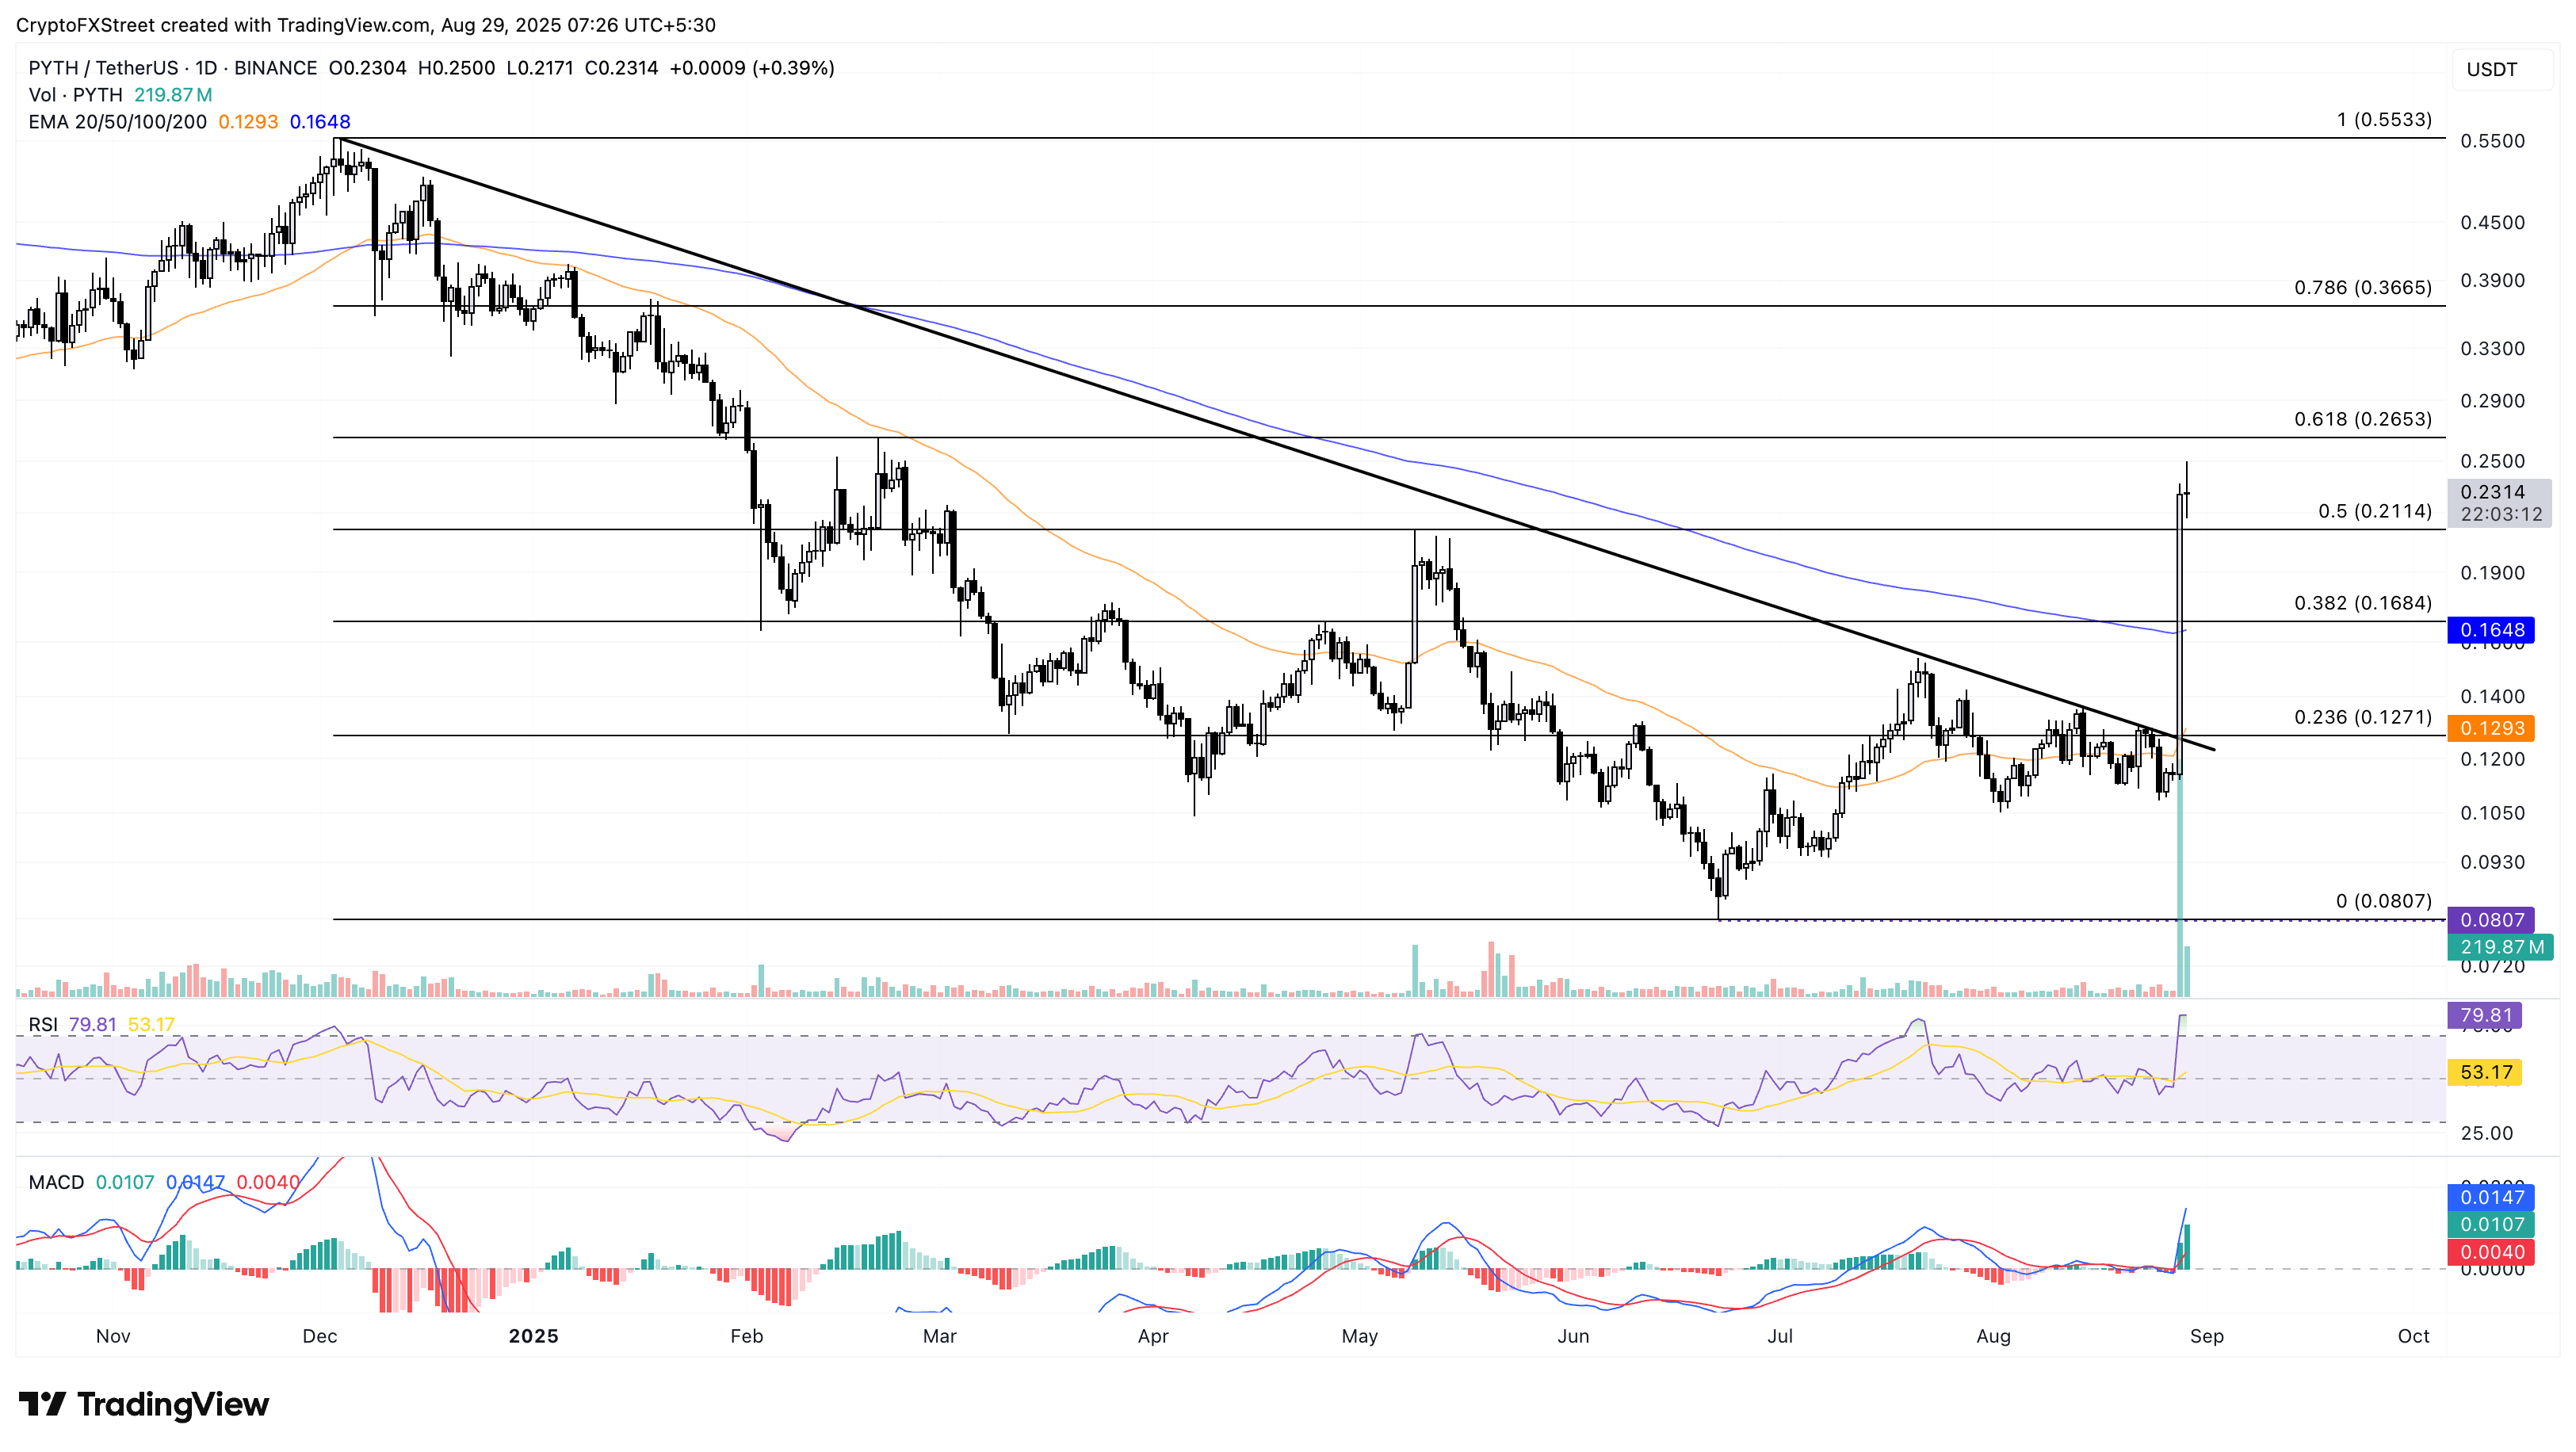
PYTH/USDT daily price chart.
On the flip side, if PYTH retraces below the 50% retracement level at $0.2114, it could decline to the 38.2% Fibonacci level at $0.1664.
Pump.fun aims to extend the wedge breakout rally
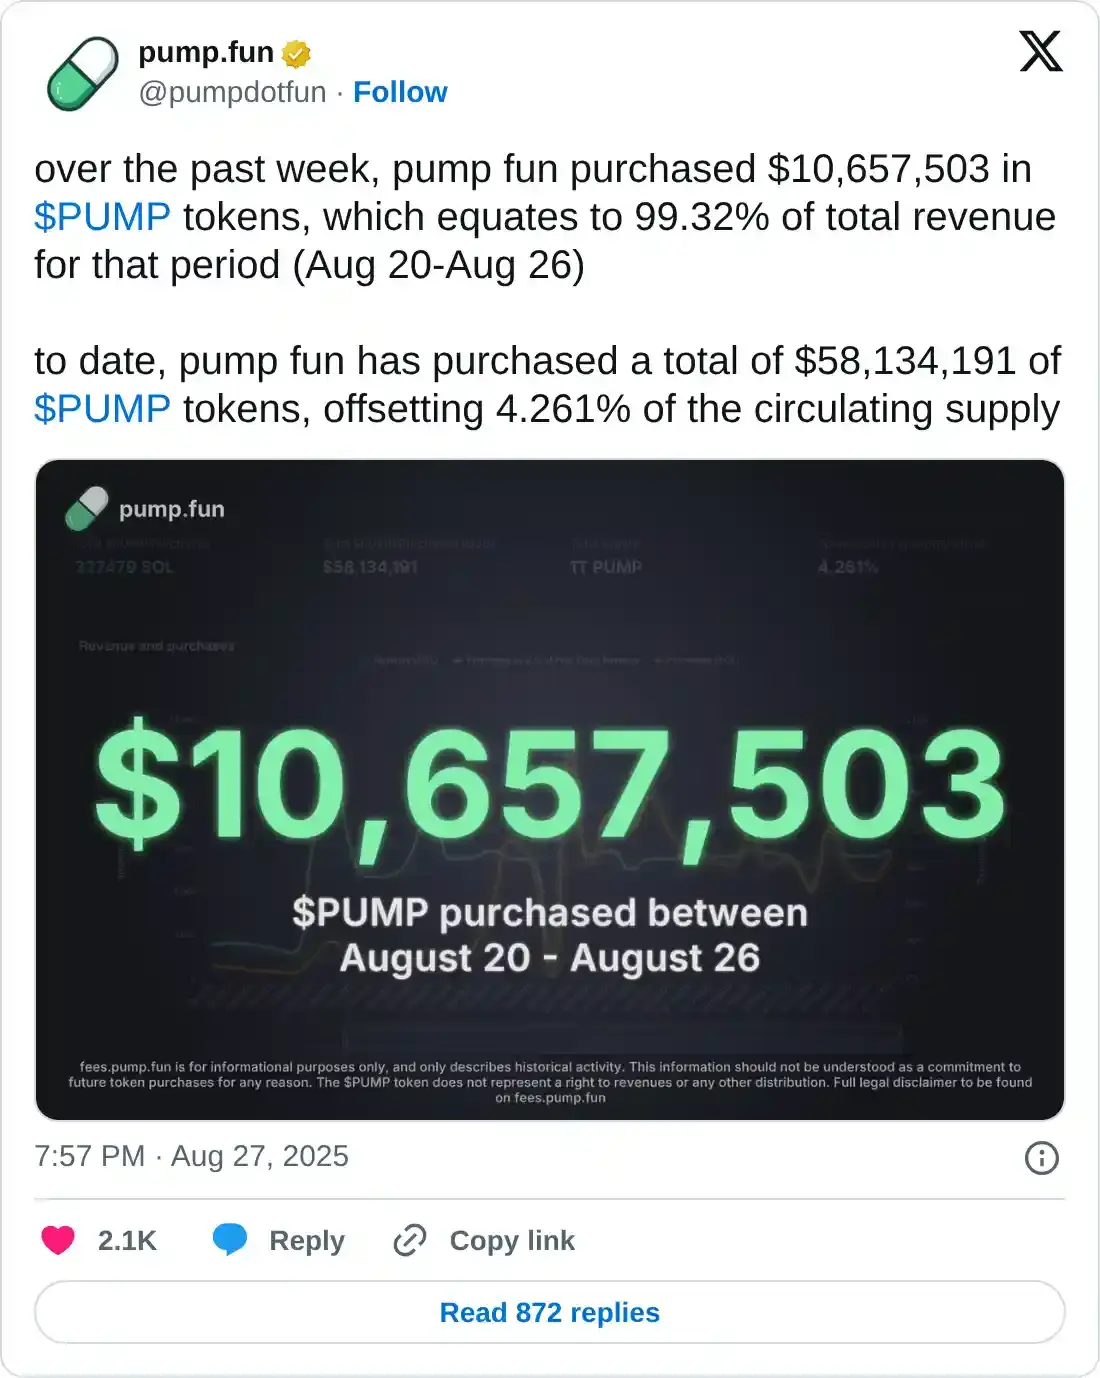
Pump.fun gains traction after spending 99.32% of revenue from August 22 to August 26 to acquire $10.65 million in PUMP tokens. This boosted the holdings to $58.13 million, which offsets over 4% of the circulating supply of tokens.
PUMP ticks lower by over 2% at press time on Friday after three consecutive days of gains. The recovery run marked a breakout from a falling wedge pattern on the 4-hour chart.
PUMP targets the retest of the 200-period Exponential Moving Average (EMA) at $0.003287.
Still, the momentum indicator signal heightened bullish pressure as the RSI held at 65 after reversing from the overbought zone. Additionally, the MACD and its signal line maintain a steady rise.
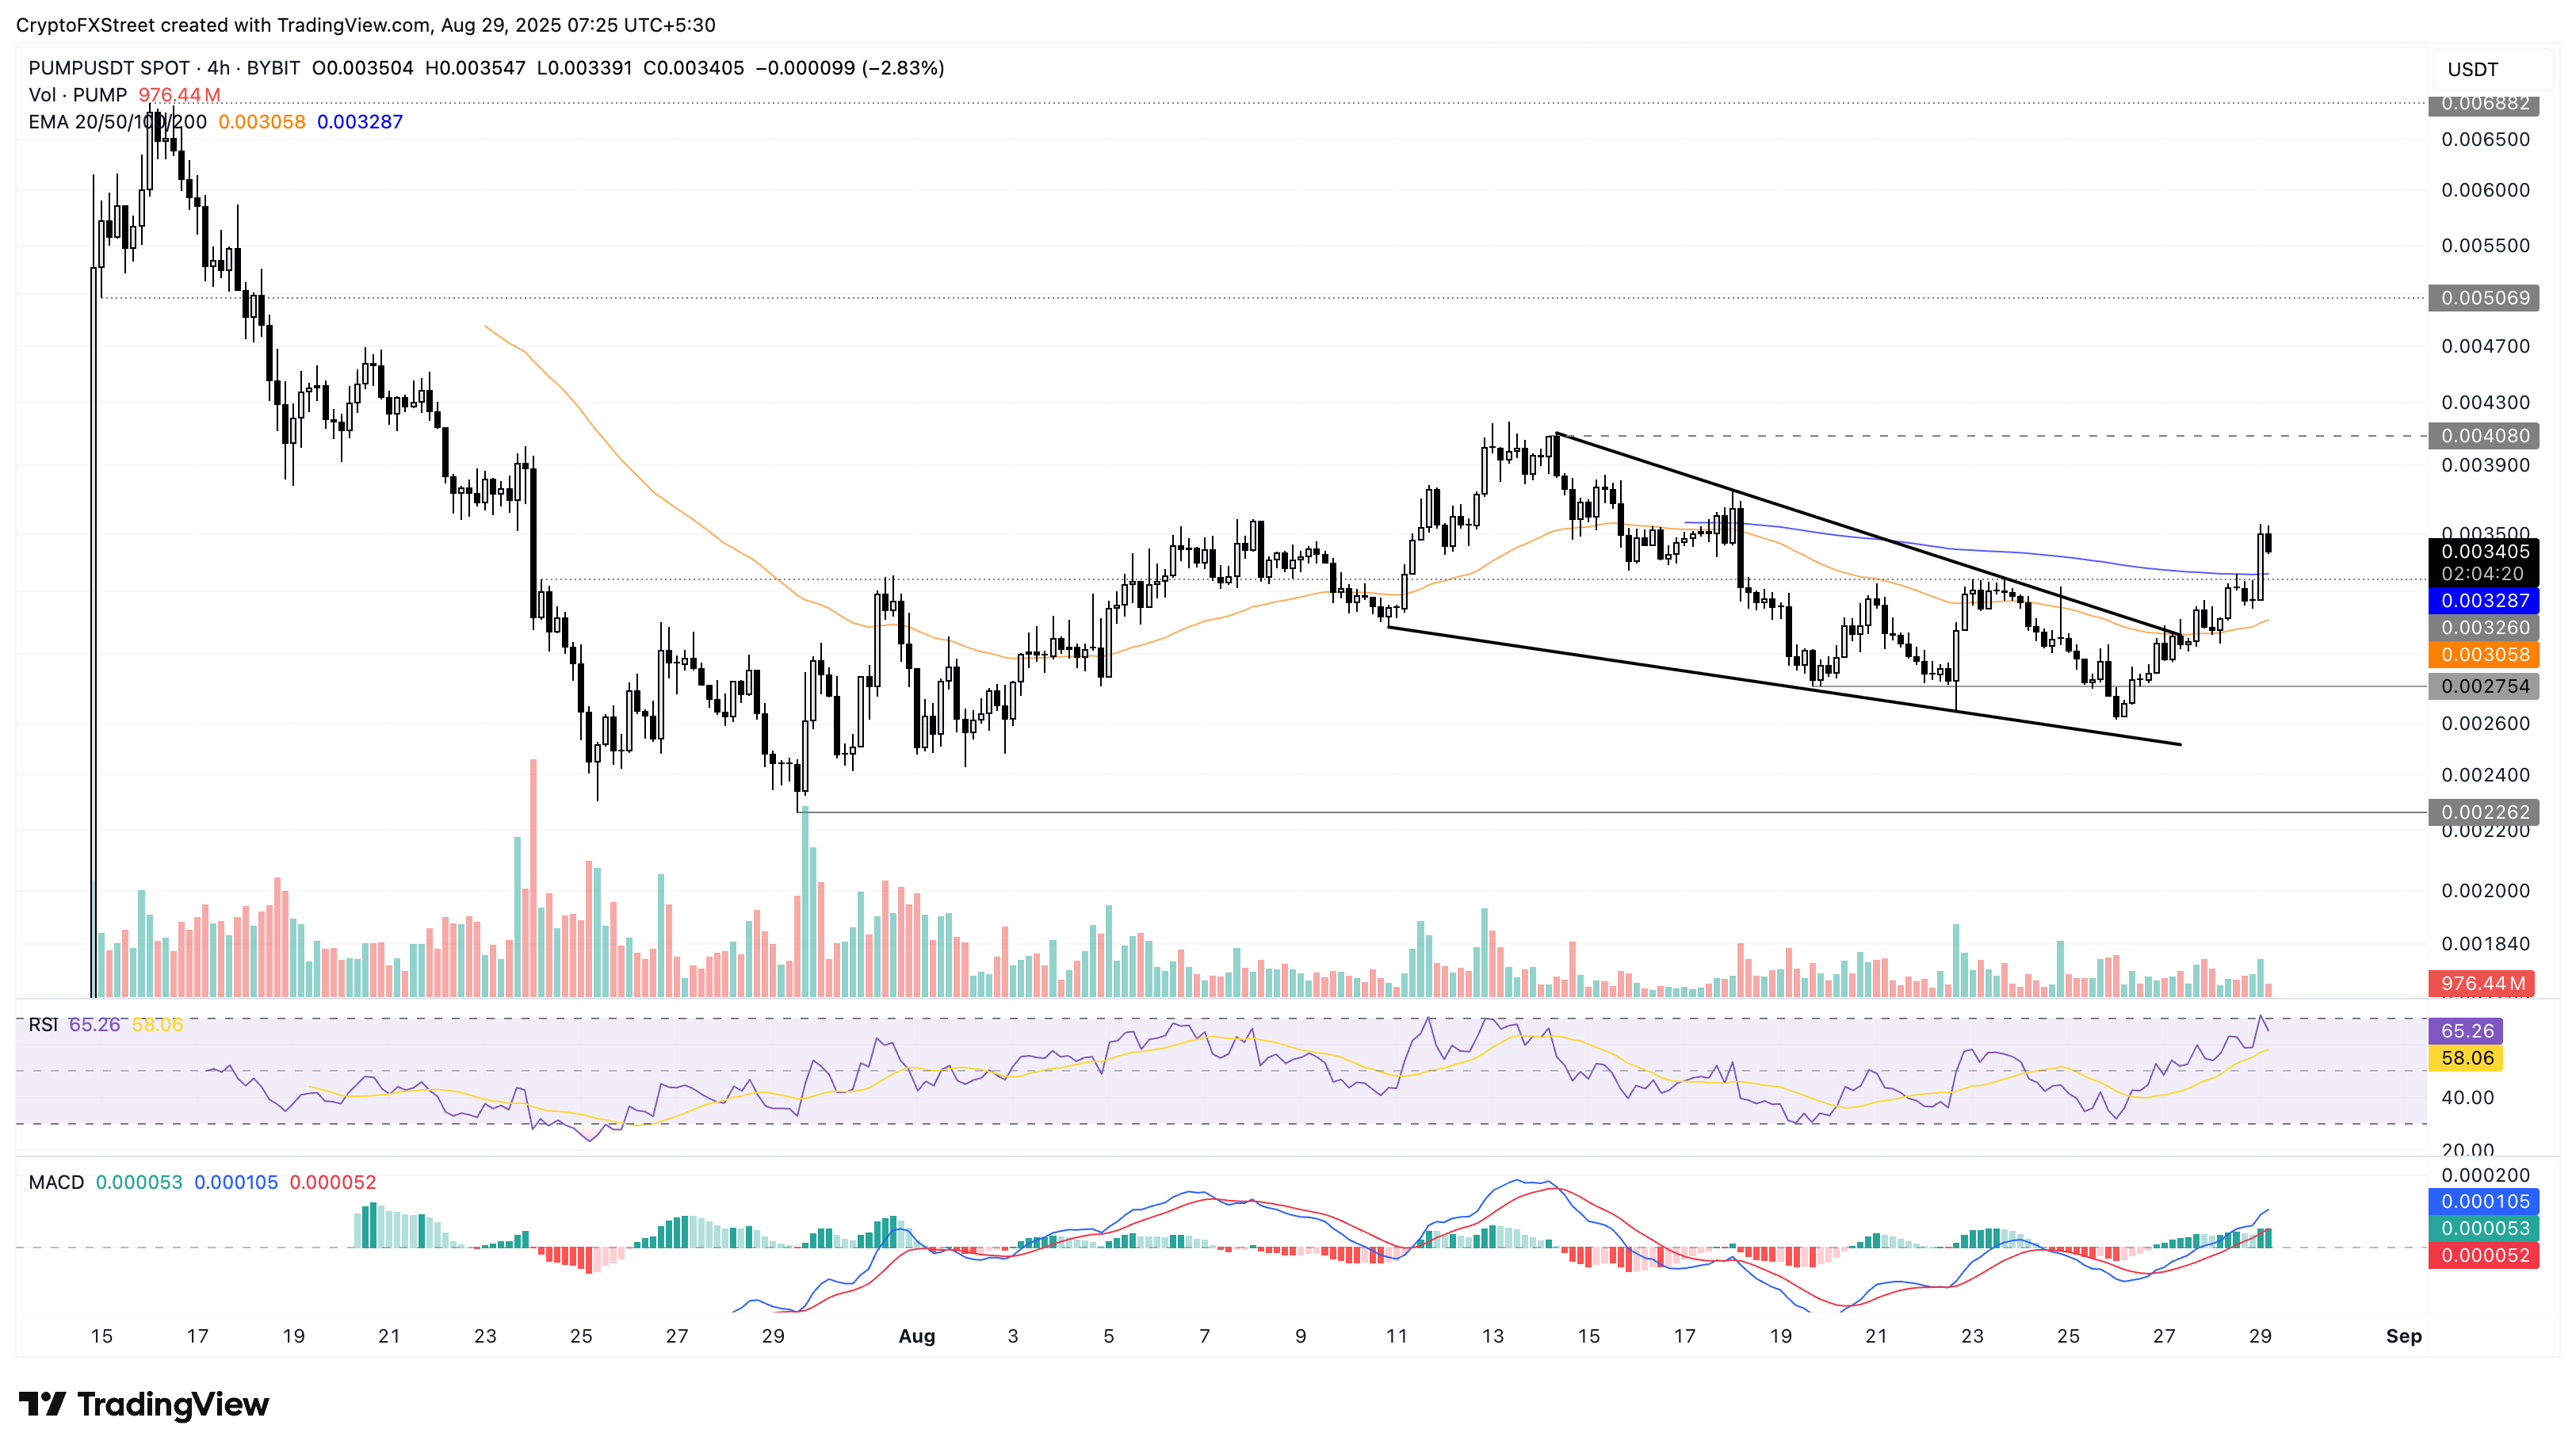
PUMP/USDT daily price chart.
Looking up, a potential bounce back from the 200-period EMA could test the $0.004080 level, acting as the peak of the falling wedge pattern.
POL eyes trend reversal with 200-day EMA breakout
POL gains traction fueled by the demands of Philippine Senator Bam Aquino to record the national budget on the blockchain, Polygon. Its native token has increased over 3% on the day at the time of writing, challenging the 200-day EMA at $0.2602.

A potential close above this level could extend the uptrend to the $0.2822 level, aligning with the 38.2% Fibonacci level, drawn from $0.7685 on December 3 to $0.1519 on April 7.
The RSI at 57 rises from the neutral regions, suggesting a resurgence in buying activity with room for further growth before reaching overbought levels.
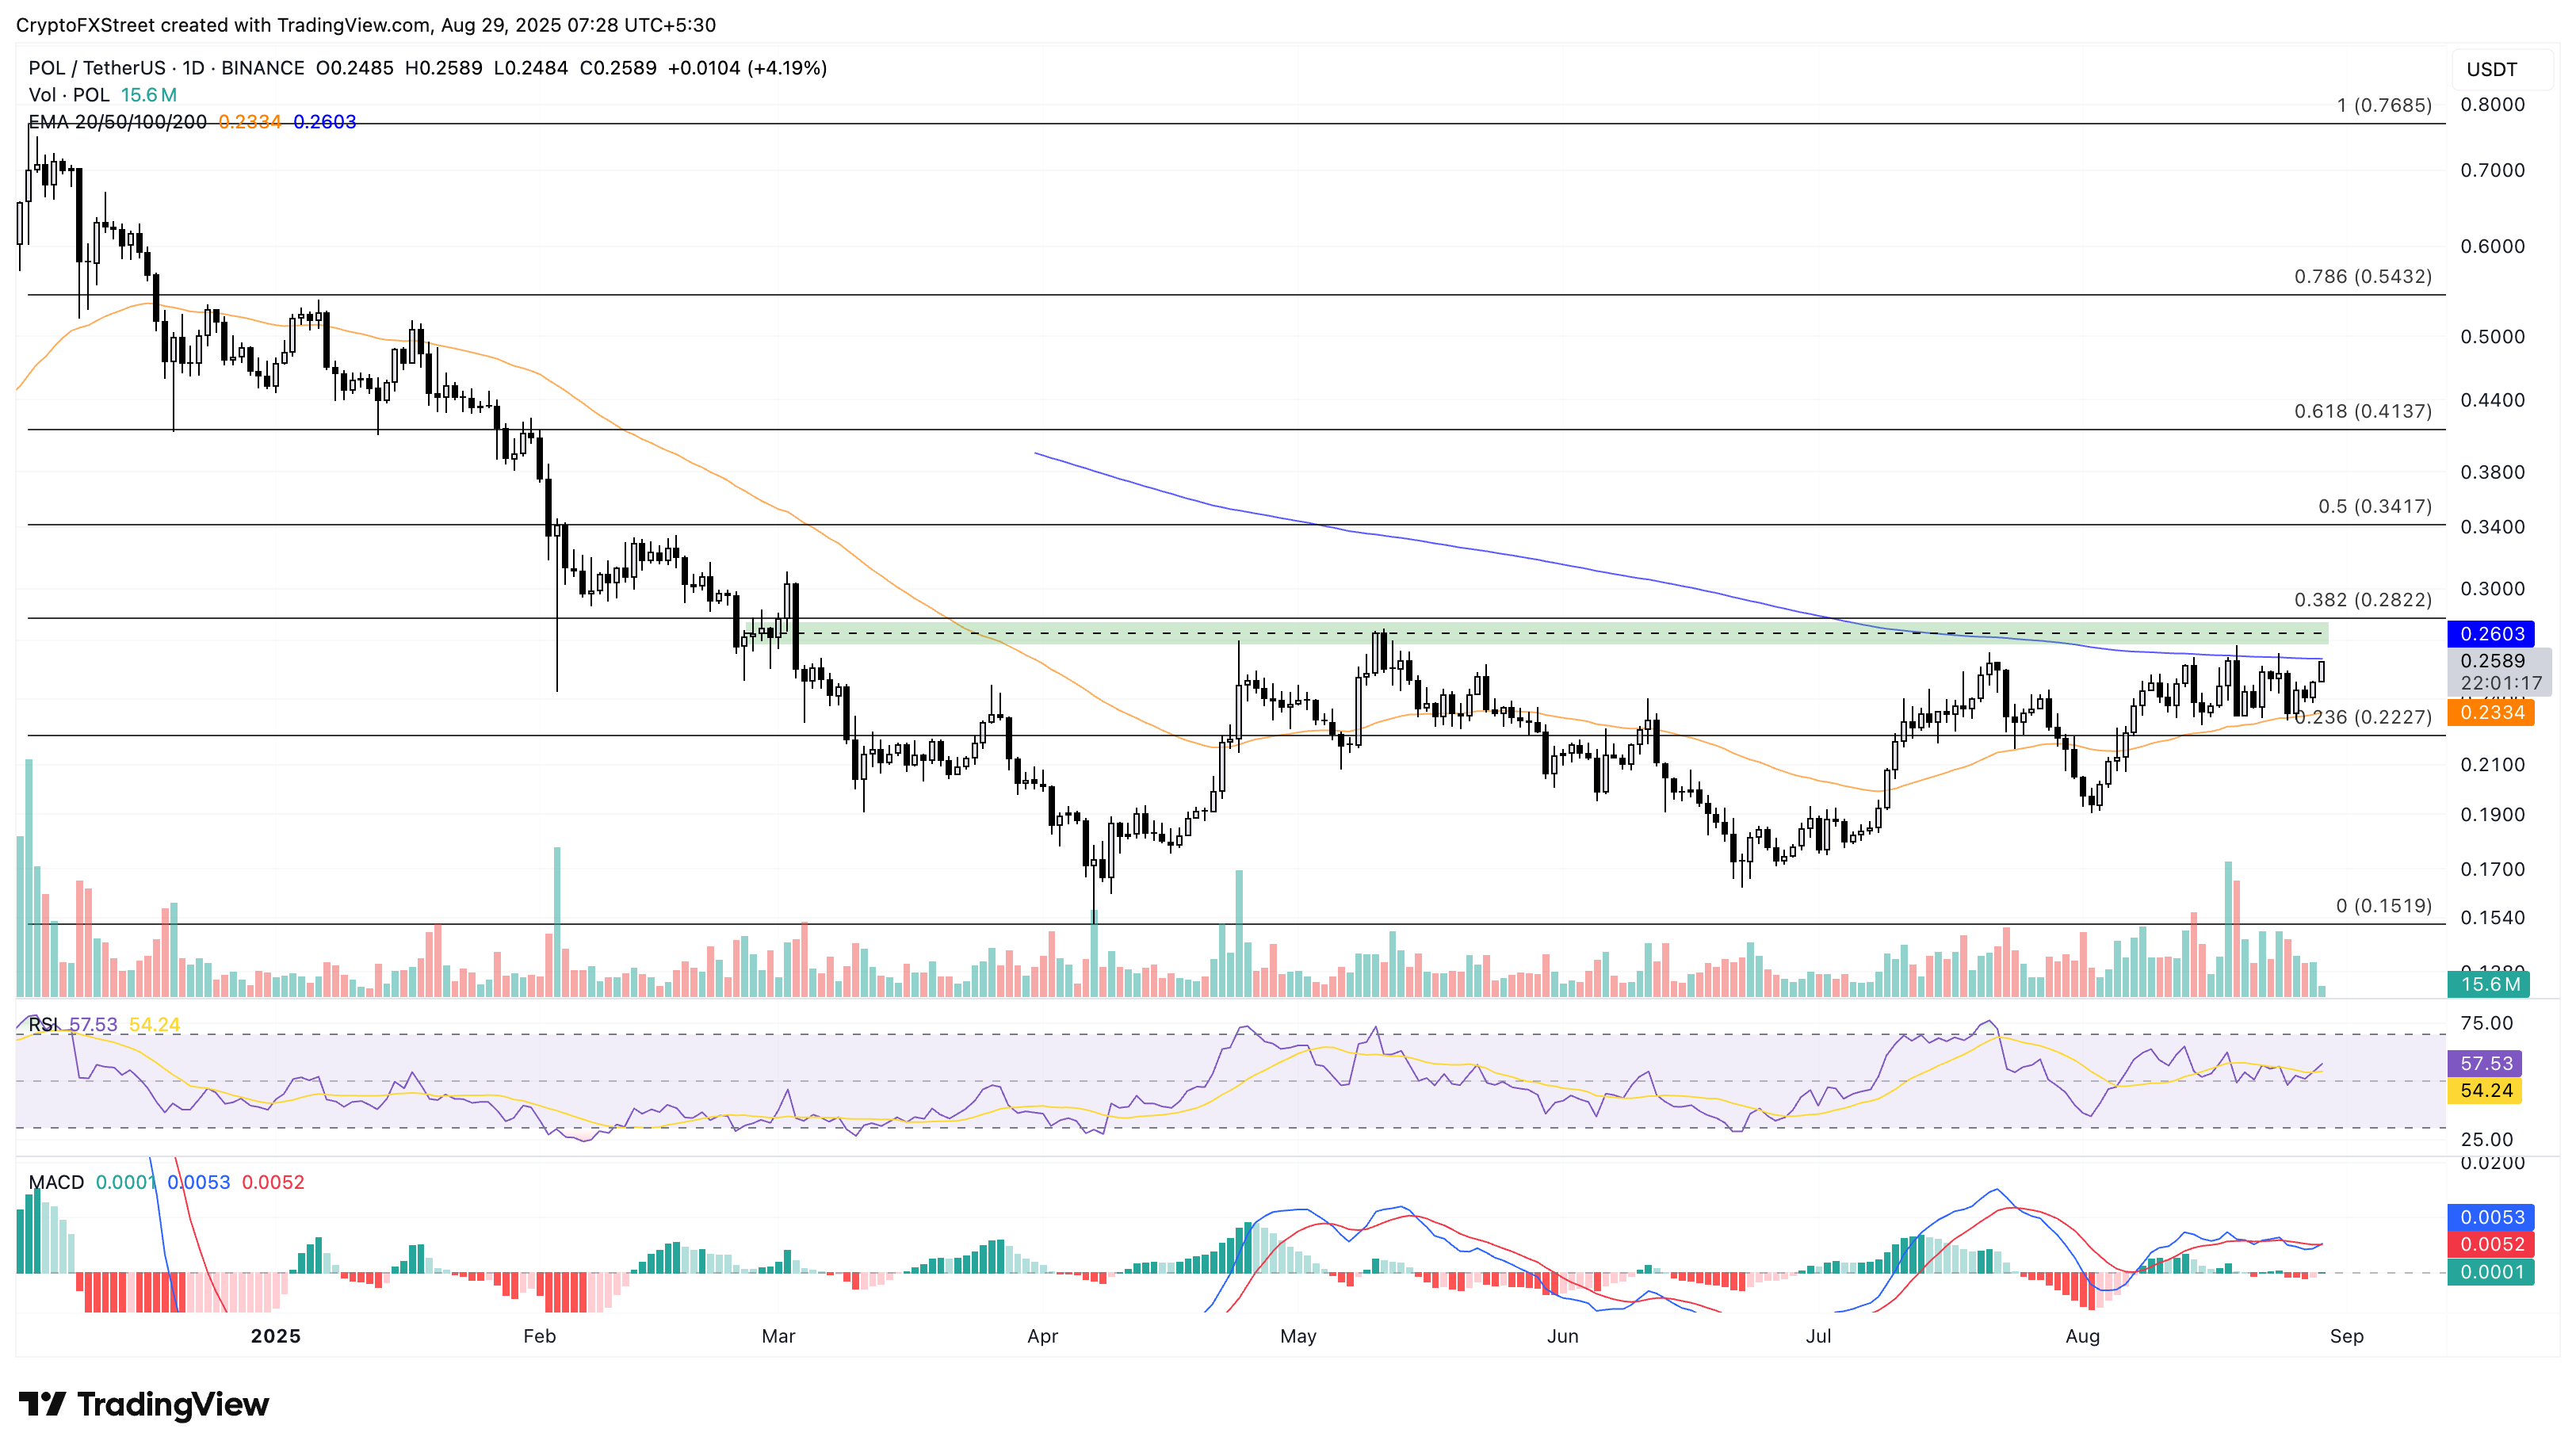
POL/USDT daily price chart.
On the downside, if MATIC experiences a bearish reversal, it could retest the 50-day EMA at $ 2,334.
Author

Vishal Dixit
FXStreet
Vishal Dixit holds a B.Sc. in Chemistry from Wilson College but found his true calling in the world of crypto.


