Crypto Gainers Price Prediction: Bonk, Floki eye further gains, Celestia hits key resistance
- Bonk edges higher after a 46% recovery last week, targeting the monthly high set in May.
- Floki posts double-digit gains to break out of a falling channel pattern and eyes the highest price in June.
- Celestia struggles to surpass a key resistance, delaying the trend reversal.

Meme coins like Bonk (BONK) and Floki (FLOKI) extend the double-digit gains from Sunday, outpacing the broader market recovery over the last 24 hours. Joining the top performers leaderboard, Celestia (TIA) edges higher, holding the Sunday gains but struggles to surpass a key resistance level. Overall, the technical outlook of top crypto gainers suggests a bullish inclination toward meme coins, while mixed signals are present for Celestia.
Bonk’s exceptional recovery targets May’s high
Bonk edges higher by 3% at press time on Monday, printing its sixth consecutive bullish candle on the daily chart. Following the 46% surge last week with a wedge pattern breakout, as displayed in the chart below, BONK’s bullish start this week targets the highest price in May.
Bonk’s intraday surge reclaims the 78.6% Fibonacci retracement level at $0.00002218, retraced from the April 7 low of $0.00000886 to the May 12 high of $0.00002581. A daily close above the $0.00002218 could target the $0.00002581 level, the inception point of the falling wedge pattern.
The technical indicators suggest an increasing trend momentum, as the Moving Average Convergence/Divergence (MACD) indicator displays the MACD and signal line crossing into positive territory. A rising trend in the green histogram bars indicates increasing uptrend momentum.
The Relative Strength Index (RSI) at 74 crosses into the overbought territory, indicating a surge in buying pressure while profit-booking risk looms.
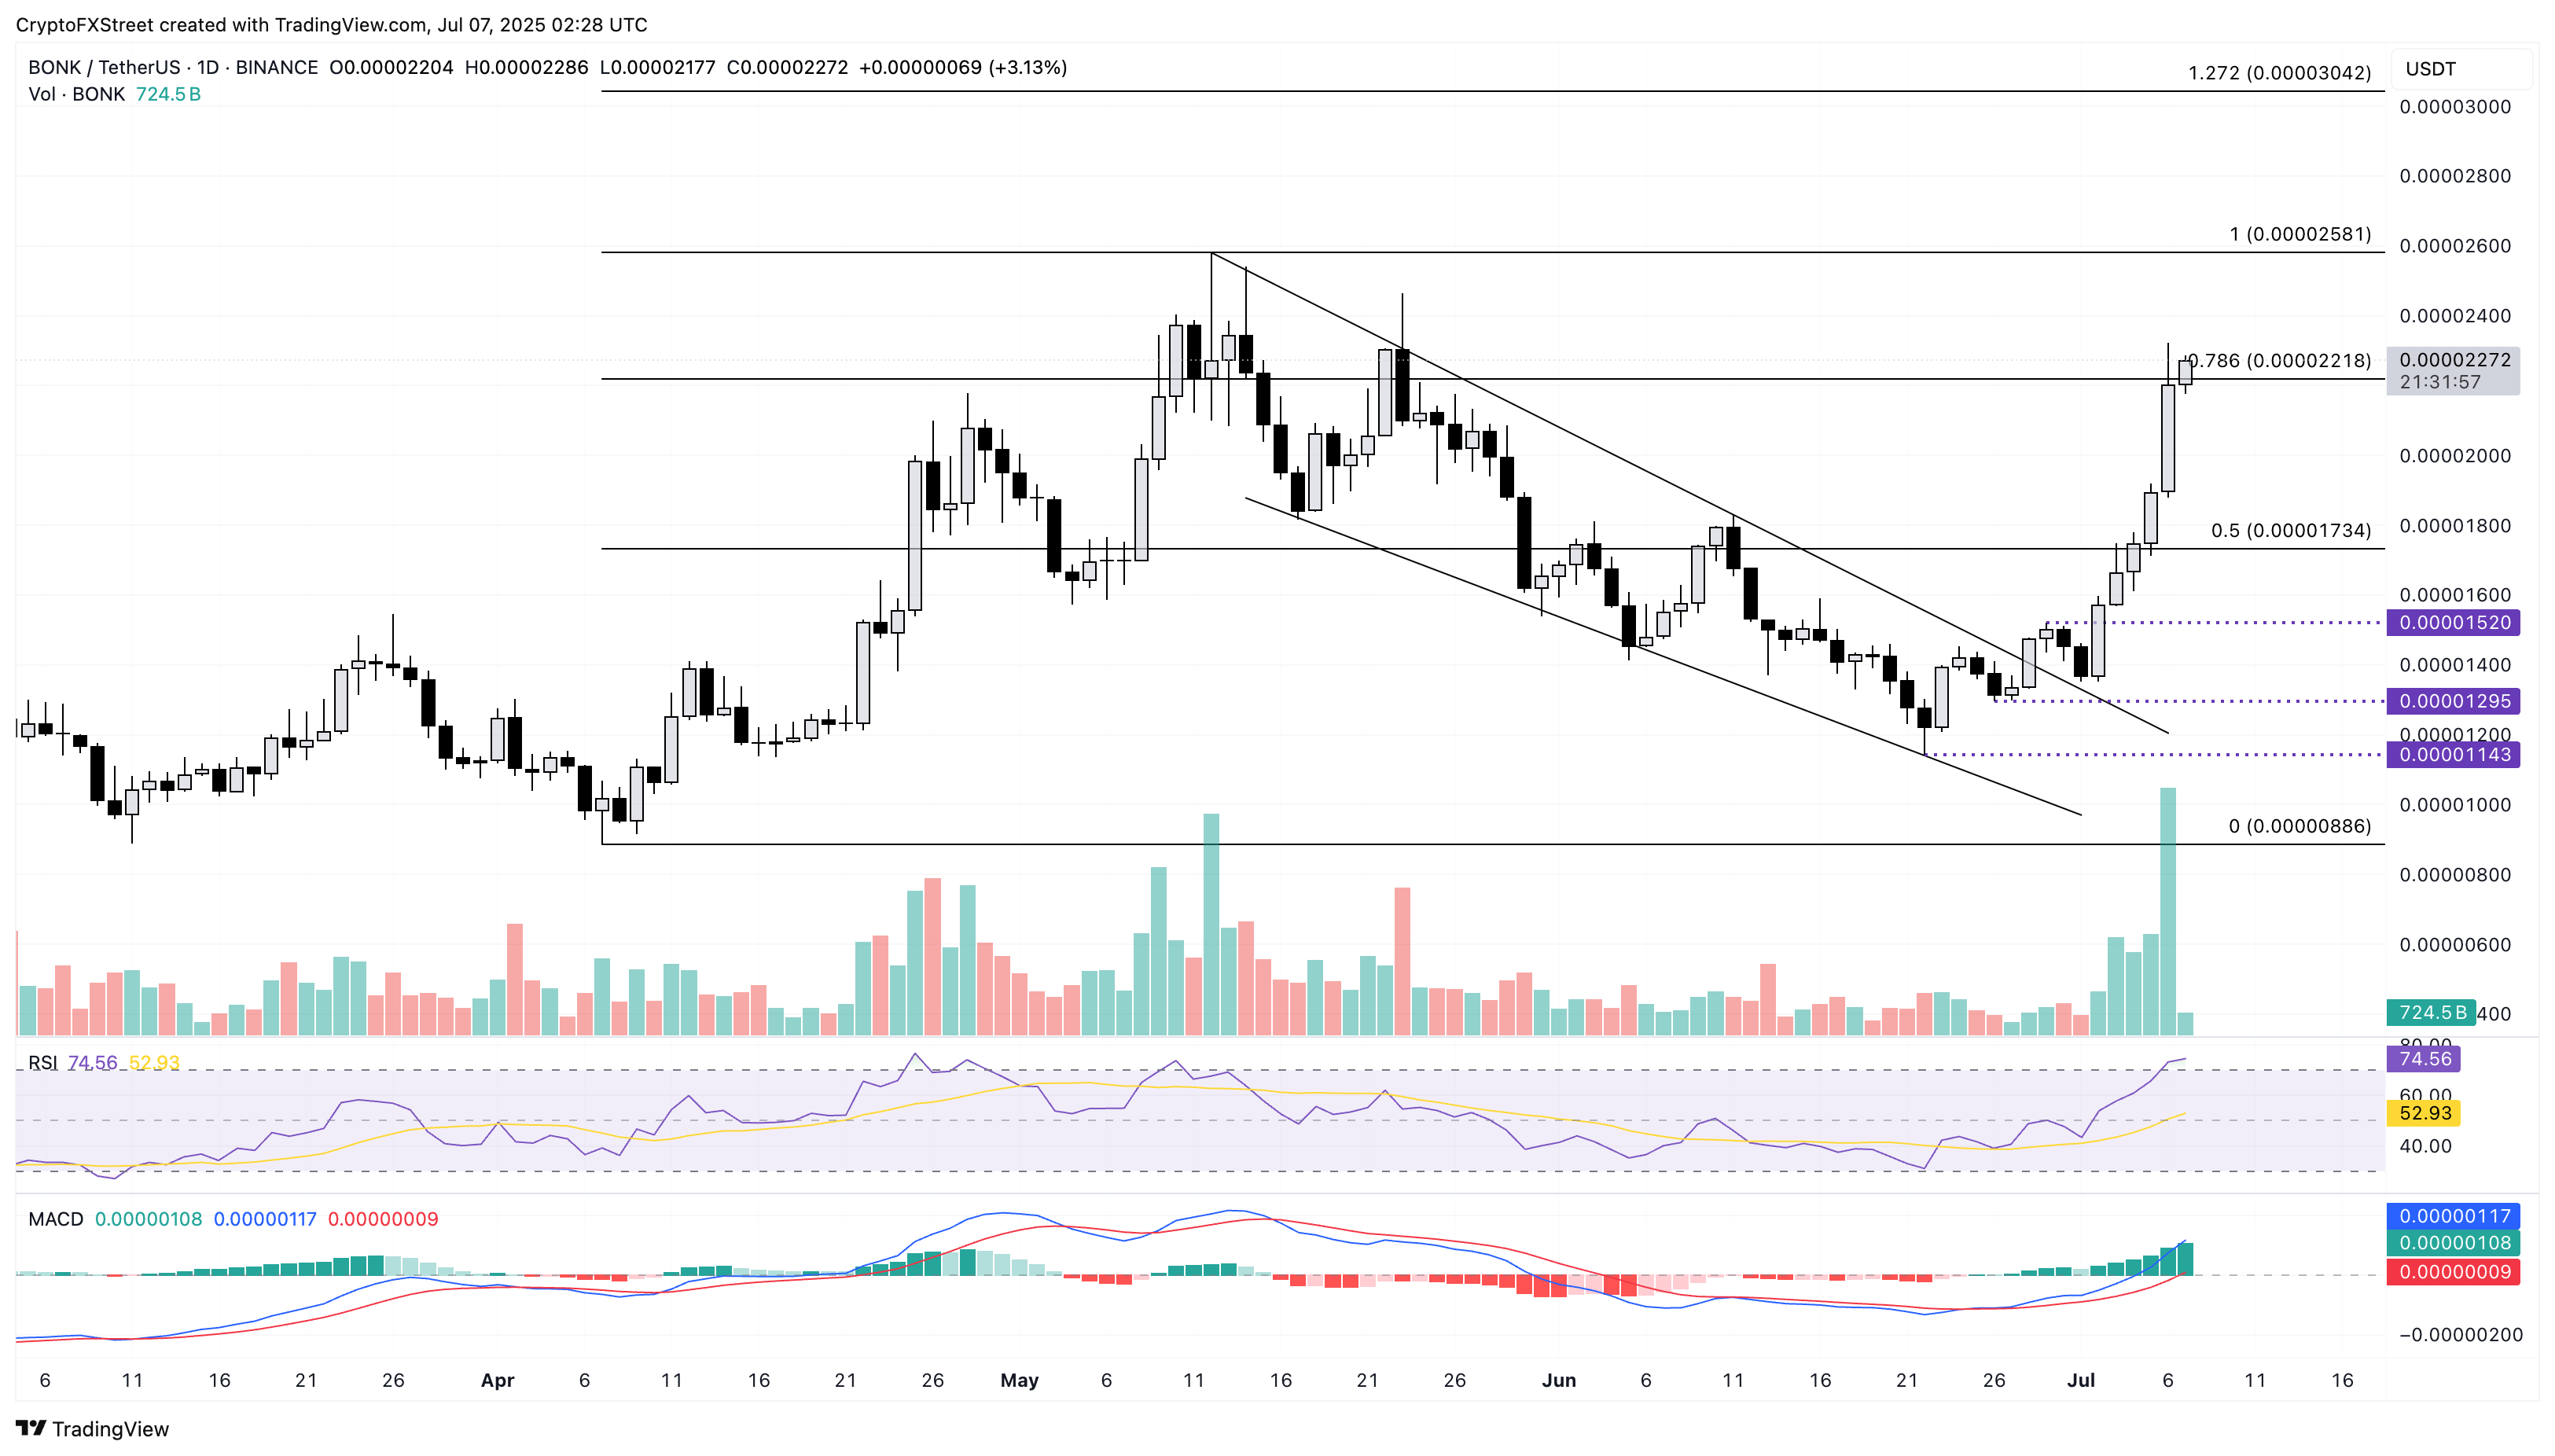
BONK/USDT daily price chart.
If BONK fails to hold grounds above $0.00002218, it could retest the 50% Fibonacci level at $0.00001734.
Floki’s breakout trend hits a key resistance level
Floki appreciated by over 2% at press time on Monday, extending the Sunday gains of 14%. The meme coin recovery breaks out of a falling channel with an upper boundary line connected by the highs of May 12 and June 11.
Floki nears a key resistance level at $0.00008807, the daily close of June 2. A clean push above this crucial level could propel the meme coin toward the highest price of June at $0.00009839.
The MACD indicator displays a rising trend in the MACD and signal nearing the zero line. An uptrend in the rising histogram bars from the same line suggests increasing momentum.
The RSI at 59 holds above the halfway level, suggesting room for growth before reaching the overbought levels.
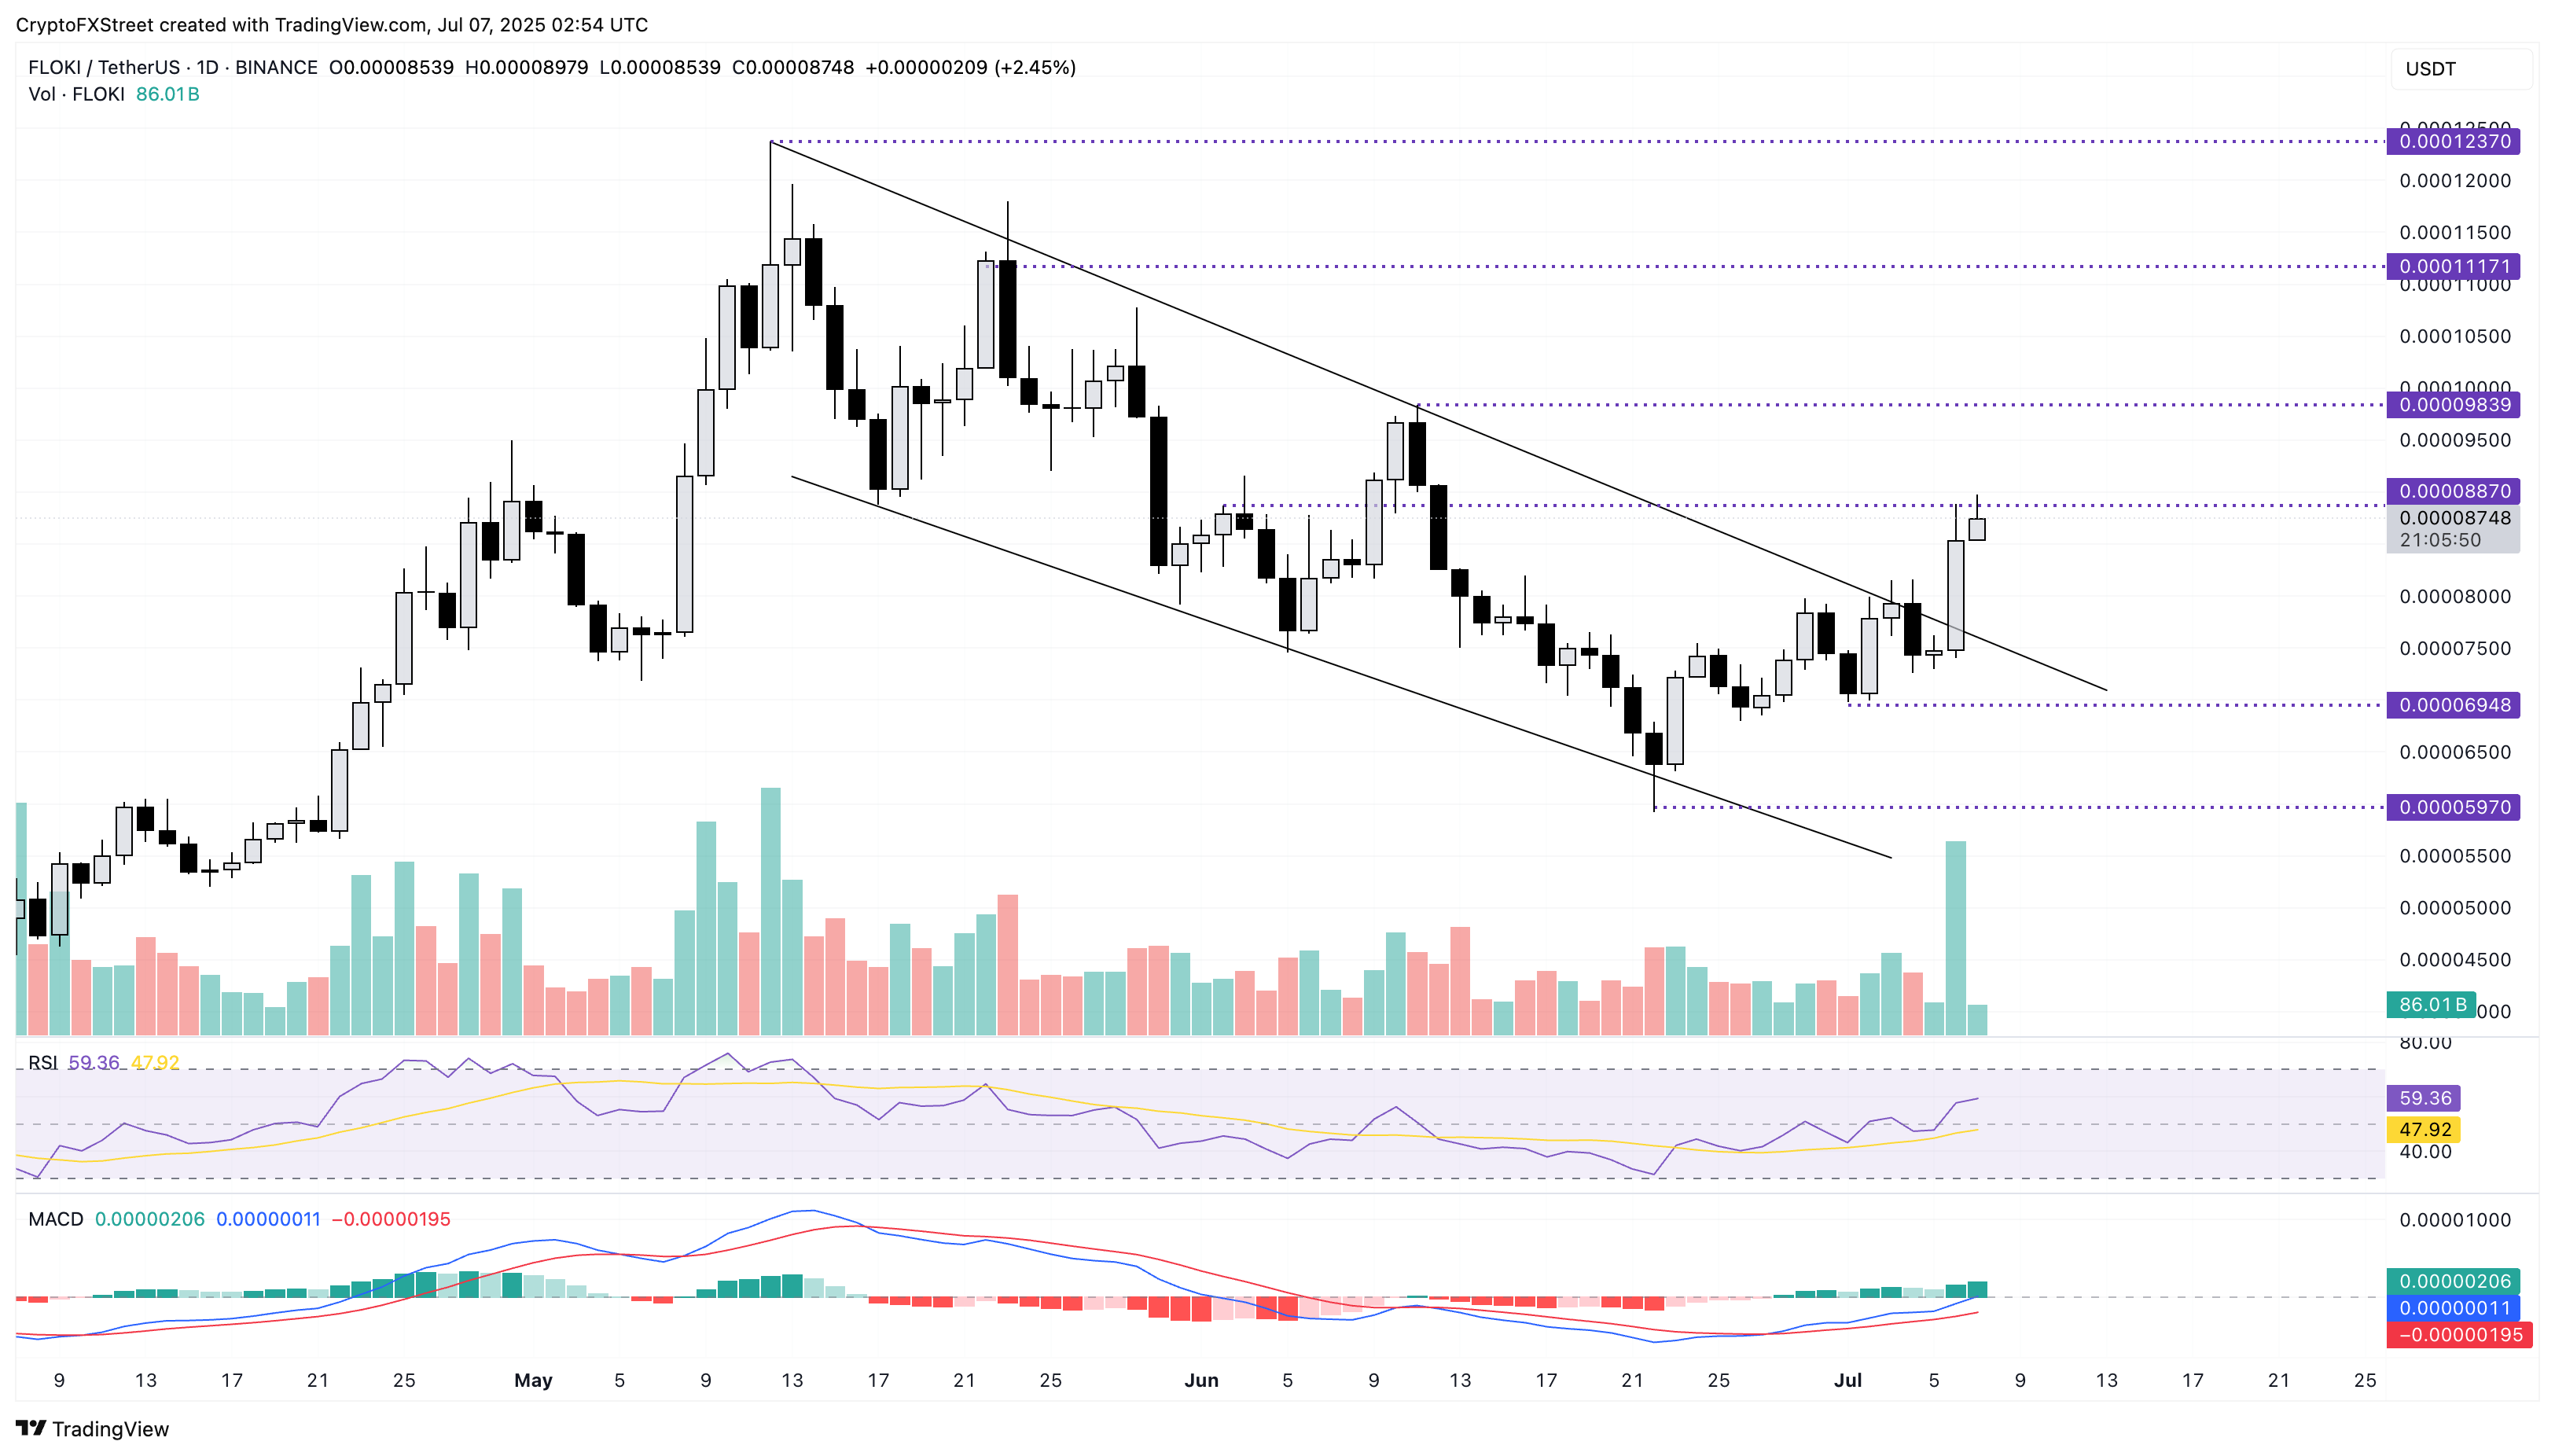
FLOKI/USDT daily price chart.
On the downside, a bearish close to the day could cause FLOKI to revert to the previous week’s low at $0.00006948.
Celestia struggles in a sideways range
Celestia recorded an 8.73% surge on Sunday while holding below the $1.68 resistance level marked by the June 24 high. Following a channel breakout, as shown on the chart below, TIA undergoes a sideways shift in trend, with the lower boundary at $1.31, the lowest price recorded in June.
A daily push above $1.68 could reinforce an uptrend in Celestia, targeting the low of June 5 at $1.93, followed by the $2.00 psychological round figure.
The MACD indicator indicates a recovery in trend momentum, while a complete bullish turnaround requires the MACD and signal line to cross above the zero line.
The RSI at 48 hovers below the halfway line, struggling to mark a bullish shift in trend momentum.
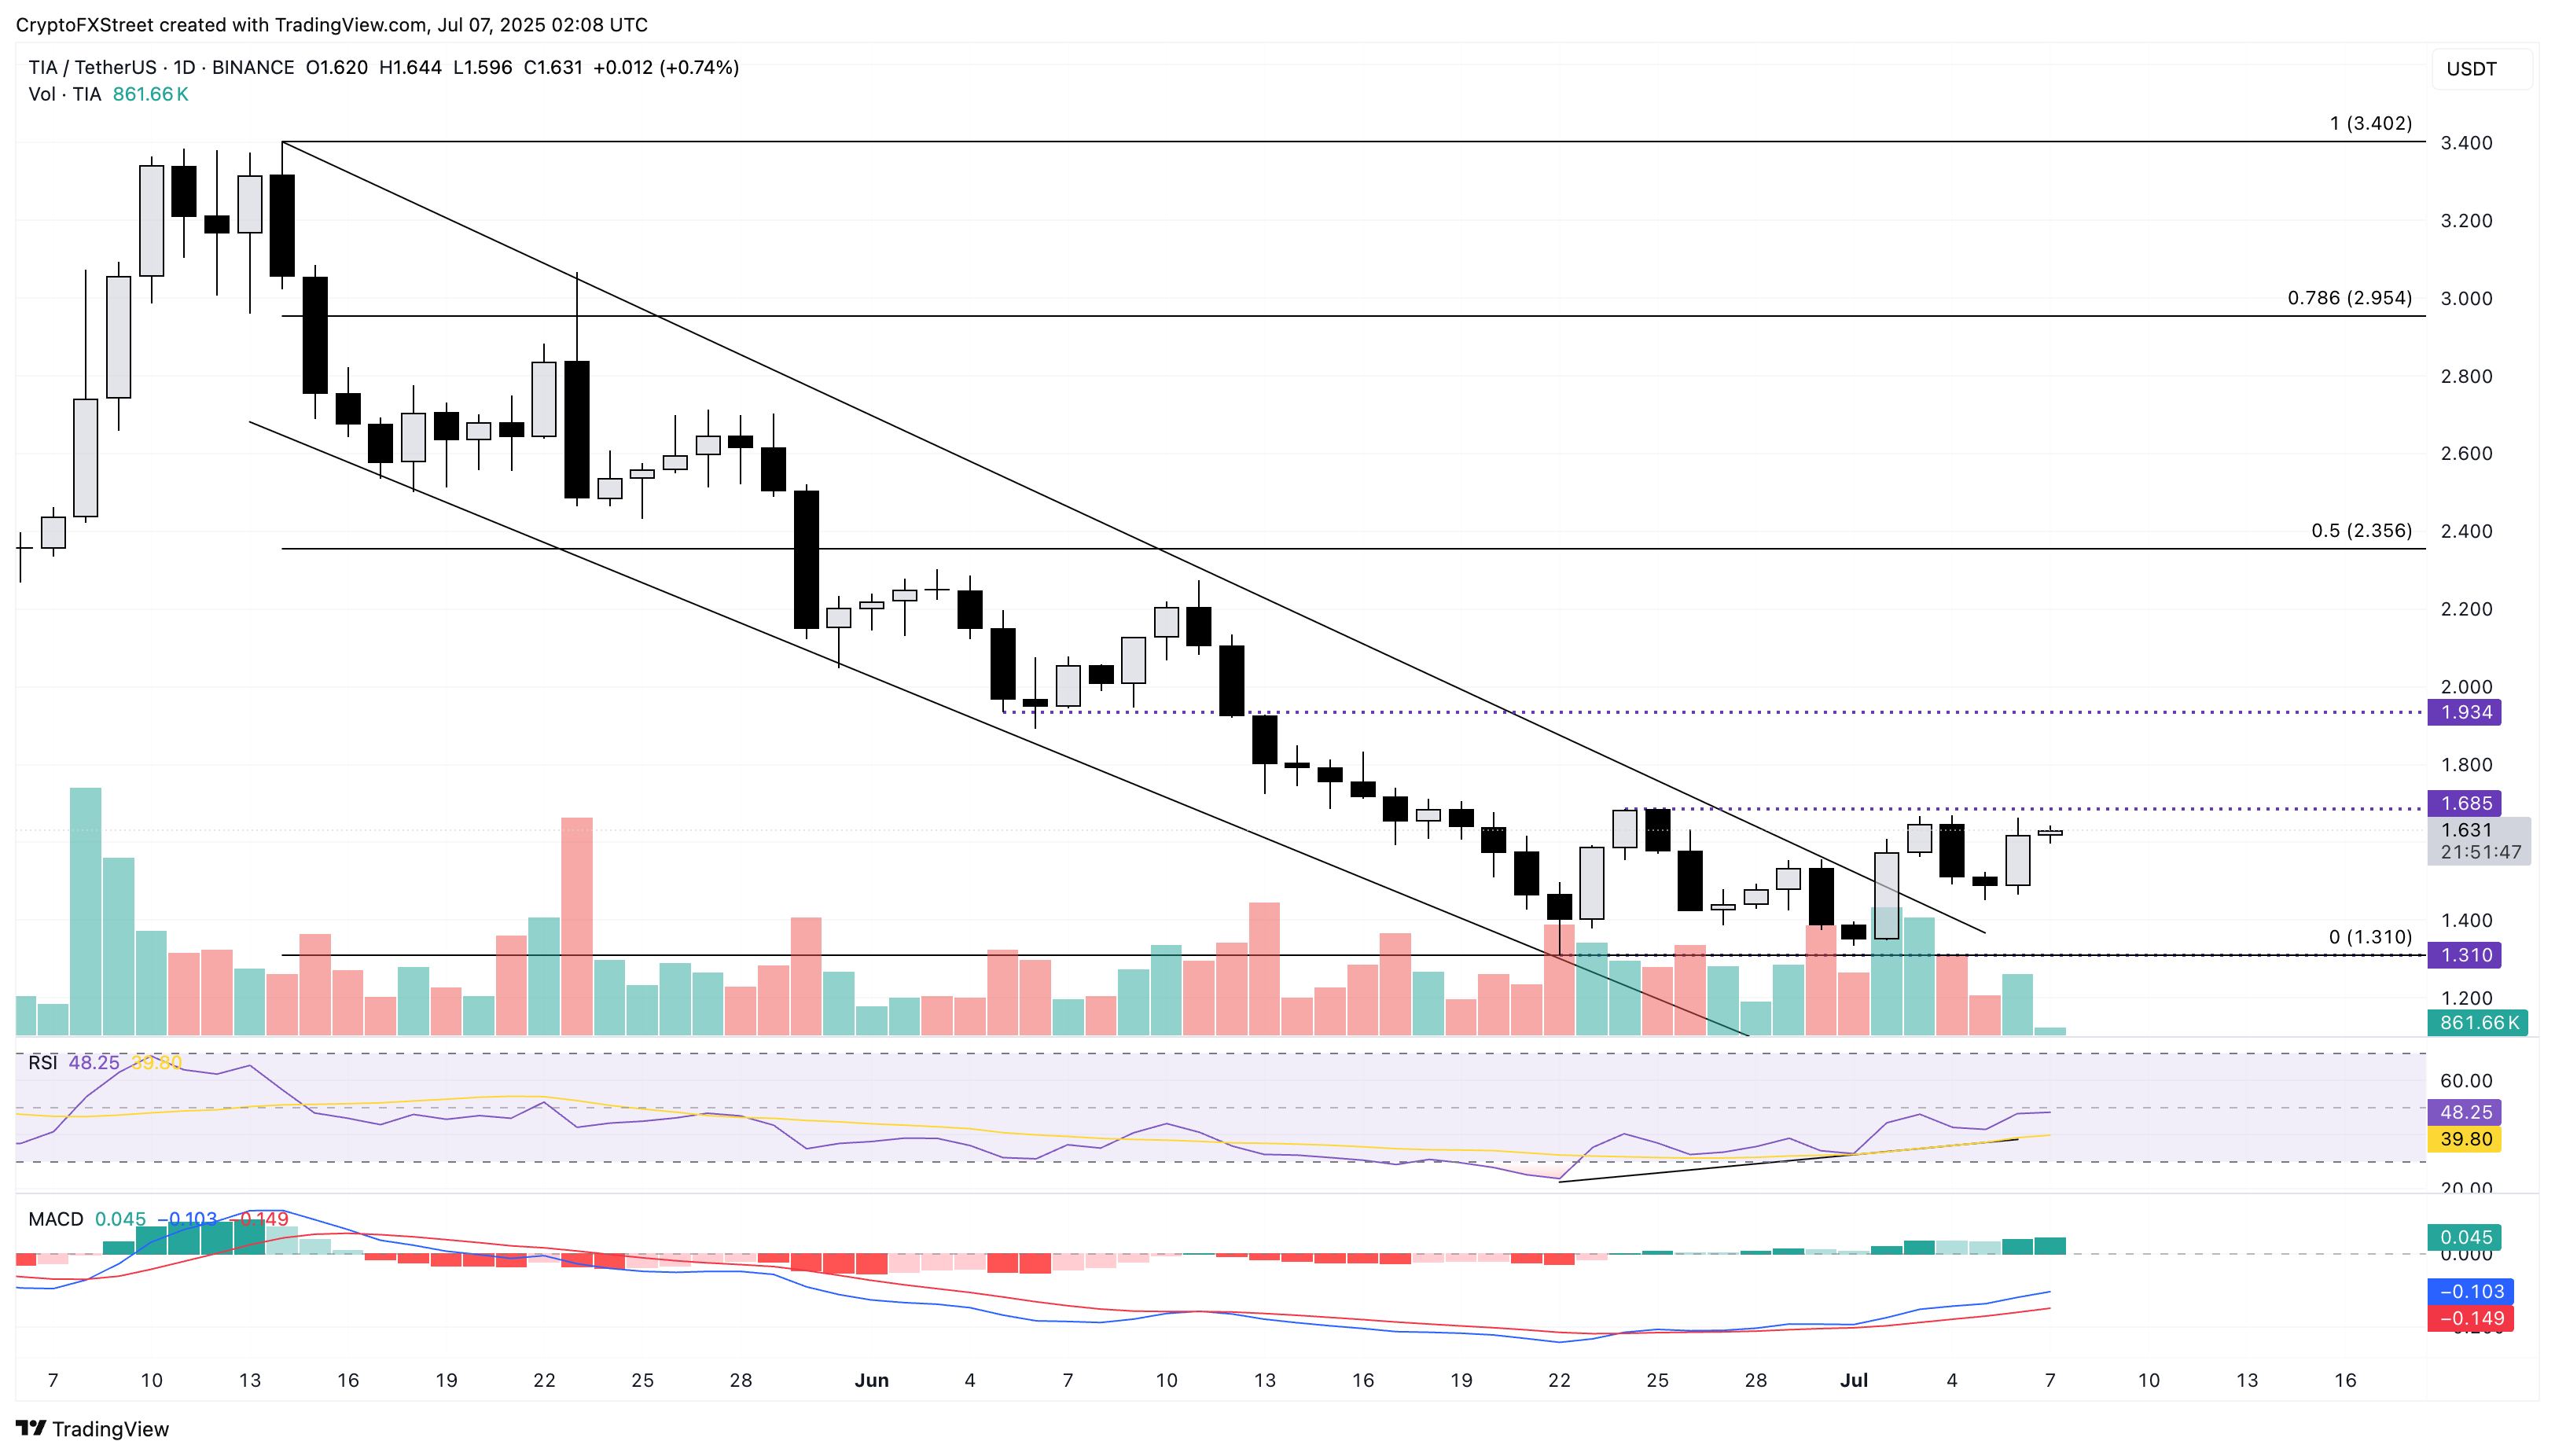
TIA/USDT daily price chart.
On the other hand, a reversal could retest the $1.31 support level, thereby prolonging the consolidation range.
Author

Vishal Dixit
FXStreet
Vishal Dixit holds a B.Sc. in Chemistry from Wilson College but found his true calling in the world of crypto.

