Celestia Price Forecast: Bullish RSI divergence in TIA fuels channel breakout chances
- Celestia’s quick intraday recovery outpaces other top altcoins in the last 24 hours.
- TIA Open Interest surges amid the growing anticipation of a trend reversal.
- The technical outlook shows a bullish RSI divergence that could trigger a breakout from a falling channel.

Celestia (TIA) edges higher by over 5% at press time on Wednesday, hinting at a morning star pattern to initiate a trend reversal. The technical outlook suggests a bullish bias, marked by an RSI divergence, while the rising anticipation of a falling channel breakout boosts TIA Open Interest in the derivatives market.
TIA Open Interest surge reflects increased optimism
CoinGlass’ data shows a 4.51% surge in Celestia’s Open Interest (OI) in the last 24 hours, reaching $169.79 million. An OI spike translates to increased inflow in the derivatives market due to heightened buying activity, suggesting a rise in optimism.
The flipping of the OI-weighted funding rate to +0.0050% from the -0.0042 bottom on Tuesday marks a bullish tilt in trading activity. Typically, funding rates turn positive due to increased buying activity in order to offset the imbalance in swap and spot prices.
However, a bearish influence maintains in the TIA derivatives as long liquidations in the last 24 hours at $333.57K outpace liquidation of short positions worth $50.72K. Due to increased wipeout of bullish positions, the long/short ratio plunges to 0.9113, indicating a greater number of active bearish positions.
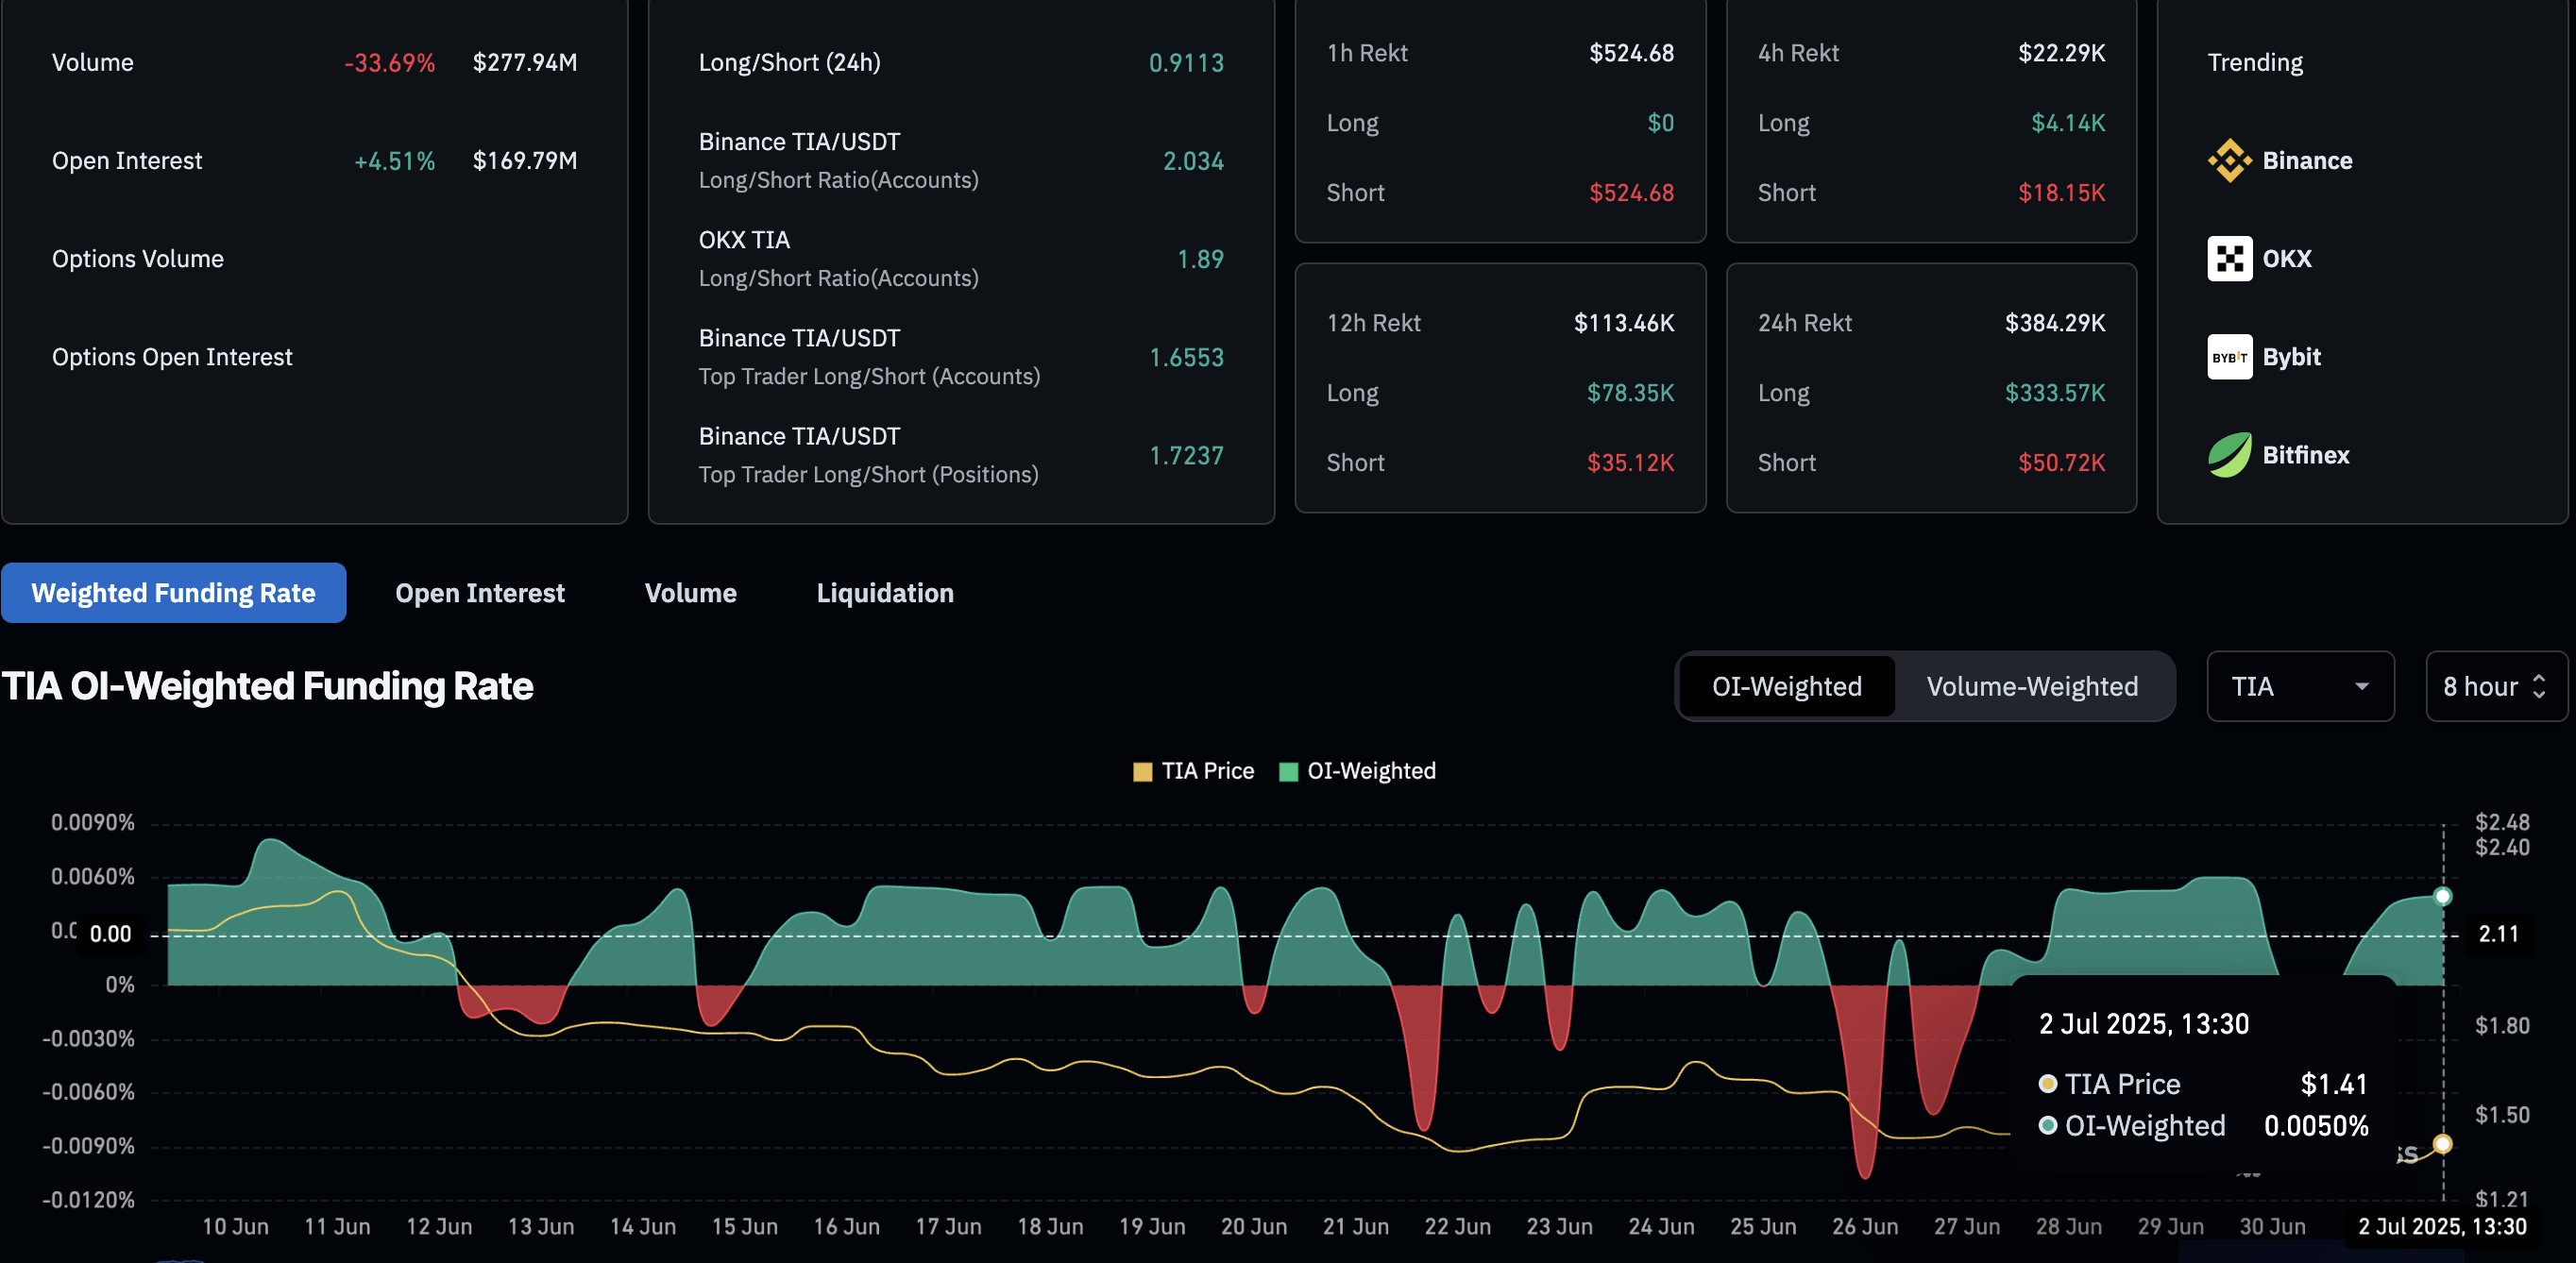
TIA derivatives. Source: Coinglass
Celestia nears a falling channel breakout
Celestia trades in the green by over 5% on Wednesday after two consecutive days of losses. However, a Doji candle formed on Tuesday hints at a morning star formation, which typically foreshadows a trend reversal after a prevailing downward trend.
Further up, Celestia’s price action on the daily chart sees a resistance trendline by connecting the May 14, May 23, and June 30 highs, while a parallel support trendline extrapolated over May 17, May 31, and June 12 lows completes a falling channel pattern.
Celestia trades near the overhead trendline, hinting at a potential breakout with a morning star pattern-fueled trend reversal. A clean push above the upper boundary line at $1.48 would mark the breakout of the channel pattern.
Investors could anticipate the uptrend to reach the June 24 high at $1.68. Optimistically, an uptrend above this level could target $2.35, aligning with the 50% Fibonacci retracement level drawn from the high of May 14 at $3.40 to the low of June 22 at $1.31.
The Relative Strength Index (RSI) at 37 maintains an uptrend on the daily chart, with higher highs, diverging from the price action holding above $1.31. Investors may view this divergence as a bullish signal, supporting the trend reversal chances.
The Moving Average Convergence/Divergence (MACD) indicator displays an uptrend in the MACD and signal lines, indicating a rising trend momentum.
However, the RSI is still below the midline of 50 and the MACD moves below the zero line, warning traders that the bullish bias is not yet well established. A close above the downtrend line, accompanied by a rising RSI and MACD above their reference lines, would bolster the bullish scenario.

TIA/USDT daily price chart.
On the contrary, if TIA drops below the $1.31 support level, it could decline towards the $1.00 round figure.
Author

Vishal Dixit
FXStreet
Vishal Dixit holds a B.Sc. in Chemistry from Wilson College but found his true calling in the world of crypto.


