|

Cosmos Price Prediction: ATOM could rally 25% despite disbelief

  • Cosmos price is currently consolidating after a 3% bounce the previous day.
  • ATOM price is aiming for $16.90.
  • Invalidation of the bullish thesis would arrive from a breach below $12.66.

Cosmos price shows a bullish narrative for a potential swing trade in the coming weeks. Traders should keep the digital asset on their watch list and anticipate a surge.

Cosmos price shows bullish potential

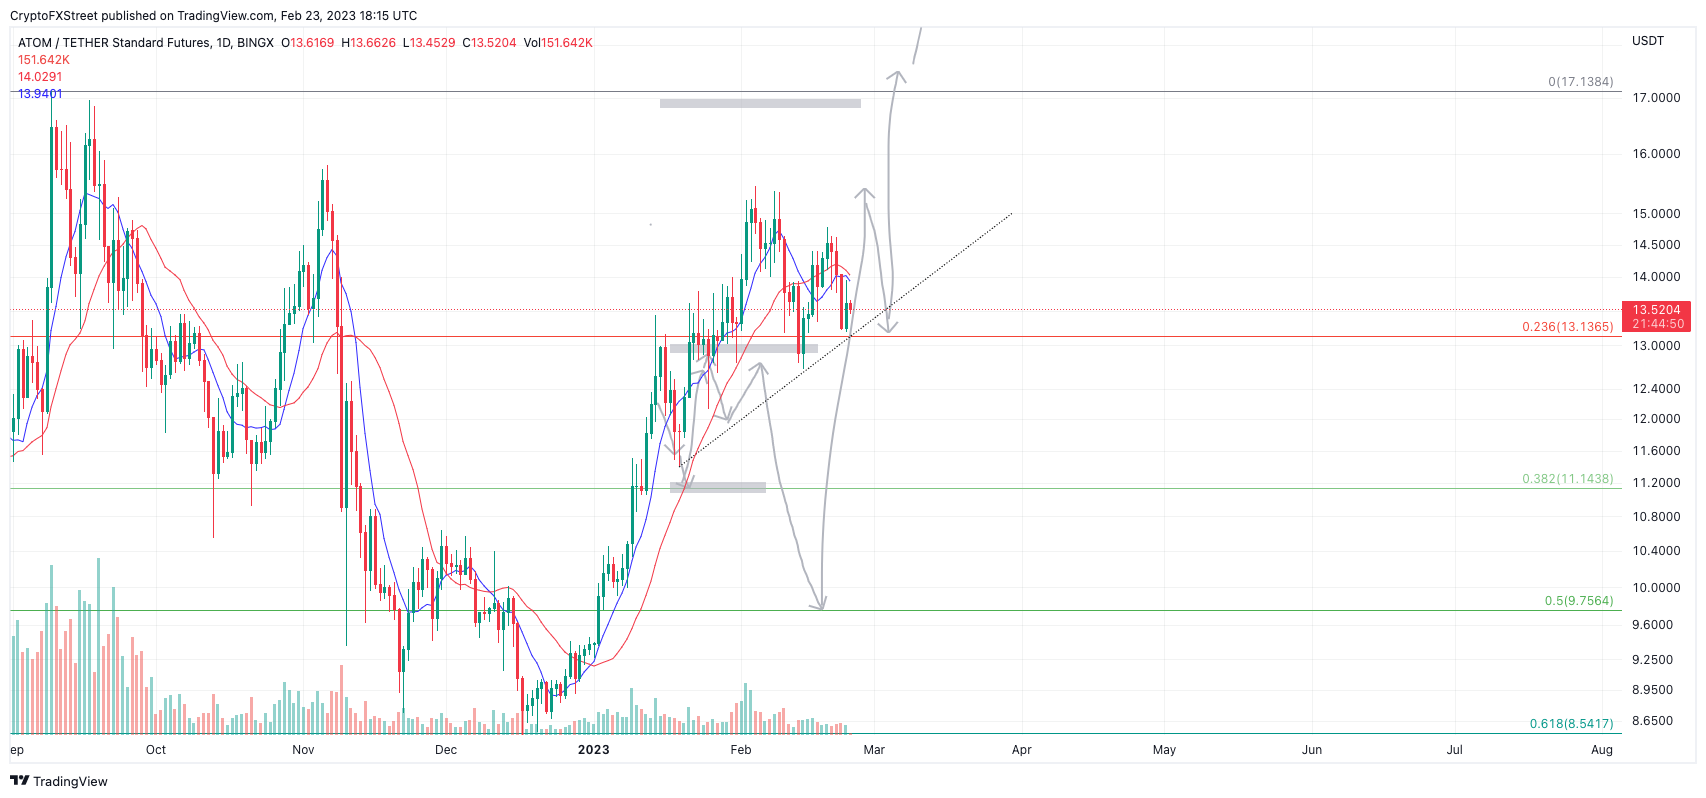
Cosmos price is currently consolidating at $13.60 after a 3% bounce from the $13.19 lows on Wednesday. The recent swing low achieved on February 21 is higher than the previous swing low, suggesting a support zone for a potential rally. Traders should remember that the consolidation occurs after the Relative Strength Index (RSI) breached overbought conditions in January. The overthrow of the RSI indicates a genuine bull run in the making.

The Volume indicator, however, confounds the bullish premise as consolidations have shown considerably fewer transactions compared to the extreme uptick in volume witnessed during the winter rally. This tapered pattern has been witnessed in previous crypto rallies, which continued the trend soon after.

The RSI and the tapering pattern on the Volume indicator for Cosmos' ATOM price depict a ramping 21-day simple moving average (SMA) pattern, which could trigger an explosive upswing for the next targeting $16.90. This target suggests a potential 25% increase in market value from Cosmos' current price.
tm/atom/2/21/22

ATOM/USDT 1-day chart

The bullish thesis would be invalidated by a breach below the recent swing low at $12.66, leading to a potential decline towards liquidity levels near the $11.00 region, resulting in a 17% decrease from ATOM's current market value.

Author

Tony M.

Tony M.

FXStreet Contributor

Tony Montpeirous began investing in cryptocurrencies in 2017. His trading style incorporates Elliot Wave, Auction Market Theory, Fibonacci and price action as the cornerstone of his technical analysis.


More from Tony M.
Share:

Editor's Picks

Aave Price Forecast: Bearish RSI divergence risks a 20% drop despite steady DeFi deposits

Aave (AAVE) extends a mild near-term recovery, holding above its 50-day Exponential Moving Average at $90.80. Aave protocol’s V3 deployment on Monad blockchain recorded over $500 million in deposits over the last month, reflecting increased user adoption.

Dogecoin Price Forecast: Bullish divergence hints at DOGE recovery

Dogecoin (DOGE) steadies near $0.070 after falling 3.5% last week. While the broader trend remains bearish, improving derivatives metrics and bullish divergences in momentum indicators suggest that selling pressure may be easing, hinting at a potential recovery. Derivatives data shows bullish sentiment among Dogecoin traders.

Top Altcoins Price Forecast: Ripple nears triangle breakout while Cardano, Hyperliquid rebound

Ripple trades above $1.00, approaching the apex of a symmetrical triangle pattern. Cardano and Hyperliquid hold steady, sustaining gains from the recent rebound. The technical outlook for XRP is mixed while ADA and HYPE maintain a bullish bias. XRP maintains a mixed tone on the daily chart, trapped between two converging trendlines forming a symmetrical triangle pattern.

Ripple and Stellar outlook: XRP and XLM steady as derivatives data points to easing downside pressure
Ripple (XRP) and Stellar (XLM) show mixed price action on Tuesday, with XRP holding above the key $1 support zone while XLM faces rejection at $0.173. Meanwhile, improving derivatives metrics alongside fading bearish momentum suggest that the downside pressure may be easing for both altcoins. Derivatives data shows mild bullish sentiment among traders.
Bitcoin: Bulls hold the line
Bitcoin (BTC) edges slightly lower, trading at $64,300 at the time of writing on Friday but holding firmly above a key support zone. US-listed spot Bitcoin Exchange Traded Funds (ETFs) support BTC as they continued to attract institutional flows through Thursday, pointing to the fourth consecutive week of net inflows.

