- Chiliz price action drops on the back of negative news out of China early Monday.
- CHZ price dipped firmly below $0.20 as lockdowns in China emerged overnight.
- Expect a drop in the coming days before price action swings back up by Friday.
Chiliz (CHZ) price action slid lower this morning as the ASIA PAC session rolled over with equities lower, the Renminbi weaker, and safe havens such as the US dollar in high demand as sudden lockdowns emerged over the weekend. Although this is not uncommon for China, it is peculiar as after the Chinese Party Congress pledges were made to avoid lockdowns and reopen the economy. Expect a turnaround once this news fades into the background and US spending pops, with black Friday set to kick in this week.
CHZ is nearing the turning point for a swing trade this week
Chiliz price is not yet recovering from the nearly 20% decline it underwent on Sunday, as traders were already throwing out their positions over the weekend. The news from China and the sudden lockdowns triggered a cramp in markets as traders grew baffled. A few weeks earlier, the Party Congress mentioned that lockdowns were to be avoided as authorities wanted to reopen the economy fully. The sidestep, with some lockdowns issued for residents to stay indoors for five days, put risk-off sentiment back on the table as risk asset classes began selling off Monday morning.
CHZ will slide further to the downside on the back of this, as overall for Monday and Tuesday there is a very light economic calendar with no natural elements that could push back against the bearish mood at hand. Expect a dip of roughly 10% for Monday and Tuesday combined, with a floor at $0.177. That level or plateau is perfect for bouncing off and triggering a rally higher. Expect by Friday to see a 40% gain and price action residing near $0.250 after the US Thanksgiving and Black Friday events.
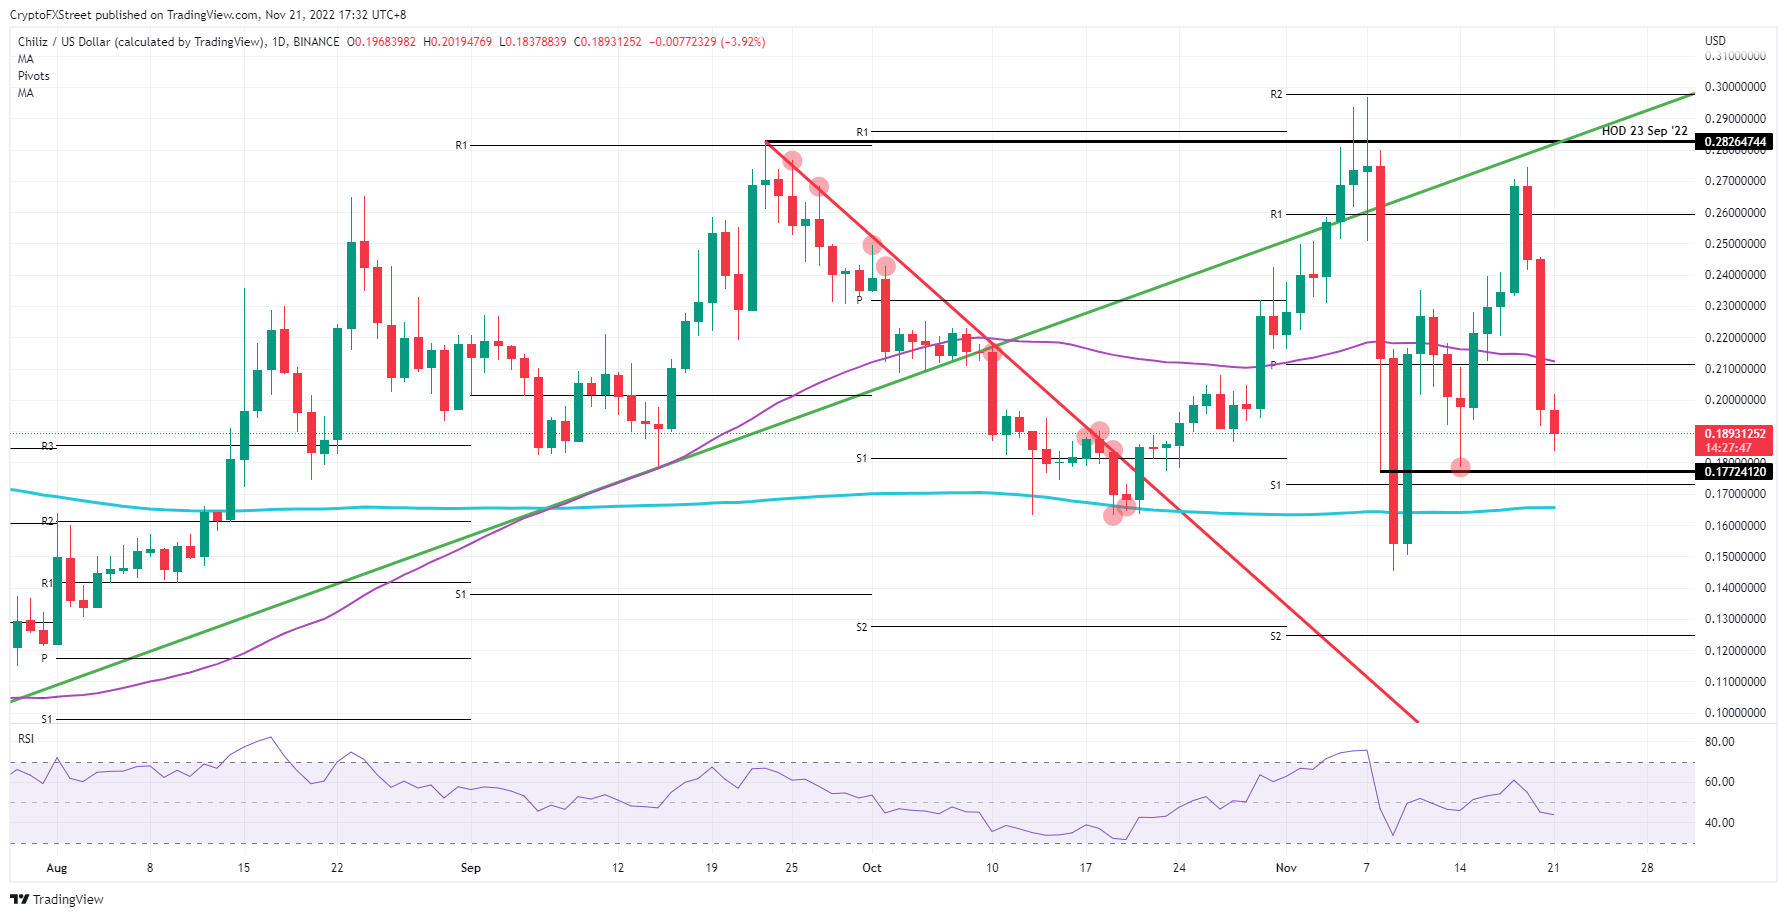
CHZ/USD daily chart
Should more external bearish elements kick in during the coming days, expect the floor at $0.177 to give way. Luckily, just below there, the monthly S1 support level is present, together with the 200-day Simple Moving Average (SMA) as a tiered failsafe system to catch any dropping knives. Unfortunately, should that 200-day SMA not hold, the road is open for a 25% implosion toward $0.13 at the monthly S2.
Information on these pages contains forward-looking statements that involve risks and uncertainties. Markets and instruments profiled on this page are for informational purposes only and should not in any way come across as a recommendation to buy or sell in these assets. You should do your own thorough research before making any investment decisions. FXStreet does not in any way guarantee that this information is free from mistakes, errors, or material misstatements. It also does not guarantee that this information is of a timely nature. Investing in Open Markets involves a great deal of risk, including the loss of all or a portion of your investment, as well as emotional distress. All risks, losses and costs associated with investing, including total loss of principal, are your responsibility. The views and opinions expressed in this article are those of the authors and do not necessarily reflect the official policy or position of FXStreet nor its advertisers. The author will not be held responsible for information that is found at the end of links posted on this page.
If not otherwise explicitly mentioned in the body of the article, at the time of writing, the author has no position in any stock mentioned in this article and no business relationship with any company mentioned. The author has not received compensation for writing this article, other than from FXStreet.
FXStreet and the author do not provide personalized recommendations. The author makes no representations as to the accuracy, completeness, or suitability of this information. FXStreet and the author will not be liable for any errors, omissions or any losses, injuries or damages arising from this information and its display or use. Errors and omissions excepted.
The author and FXStreet are not registered investment advisors and nothing in this article is intended to be investment advice.
Recommended Content
Editors’ Picks
Ripple's move above this key level could trigger nearly 50% rally for XRP
Ripple has overcome a critical resistance level and flipped into a support floor on the weekly time frame. This development happened while XRP tightly consolidated for roughly 250 days. Investors can expect XRP to kickstart a massive rally.
Optimism price outlook with nearly $90 million worth of OP tokens flooding markets on Friday
Optimism volatility has shrunk in the ours leading to the network’s cliff unlock. It joins the likes of dYdX and Sui, which have similar events on their calendars. As token unlocks are often considered bearish catalysts, investors should brace for a reaction after the event.
Top 3 Price Prediction Bitcoin, Ethereum, Ripple: Retail watches from the sidelines with a bias for shorts
Bitcoin could clear $73,777 peak as BTC bulls resurface. Ethereum might fall 10% before next leg up as ETH RSI teases with sell signal. XRP could lose $0.6000 threshold as Ripple bulls fail to show up.
Jito price could hit $6 as JTO coils up inside this bullish pattern
Jito price action shows a potential cup and handle formation. Based on theoretical measurement rules, a successful breakout could yield a 56% rally to $6.0. A breakdown of the $3.86 support level would create a lower low for JTO and invalidate the bullish thesis.
Bitcoin: BTC may have recovered, but is it out of the woods?
Bitcoin’s (BTC) upward momentum has shown a significant decline for the past two weeks or so. This development led to a bearish signal on the weekly and an uncertain outlook on the monthly.