Chainlink Price Prediction: LINK prepares for a spike in profit-taking
- Chainlink price has skyrocketed by a whopping 70% in the last ten days to hit a new all-time high of $51.30.
- Following the milestone, multiple sell signals have emerged, suggesting an incoming spike in profit-taking.
- Transaction history shows that the $32.80-$43.70 level represents a massive support wall.
-637336005550289133.jpg)
Chainlink price has enjoyed an impressive bull rally over the past week that has seen it rise to new all-time highs. Now, a particular technical index shows that investors may be inclined to realized profits.
Chainlink price looks primed to retrace
Chainlink has seen its market value rise by more than 70%. In the past ten days, the decentralized oracles token has gained over 20 points. It went from a low of $29.80 on April 25 to a new all-time high of $51.30 recently.
Despite the significant gains incurred within such a short period, the Tom DeMark (TD) Sequential indicator suggests LINK is bound for a correction.
This technical index presented a sell signal on Chainlink’s daily chart. The bearish formation developed as a green nine candlestick anticipating a one to four daily candlesticks correction before the uptrend resumes. A red two candlestick trading below a preceding red one candle could serve as confirmation that Chainlink price is poised to decline further.
A glimpse at the decentralized oracles token’s daily chart reveals that the TD setup has been incredibly accurate at anticipating local tops on this altcoin’s trend. The four sell signals that this indicator has presented since December 2020 were all validated, resulting in significant retracements.
Therefore, the current pessimistic forecast must be taken seriously even though substantial price discovery is still happening around Chainlink.
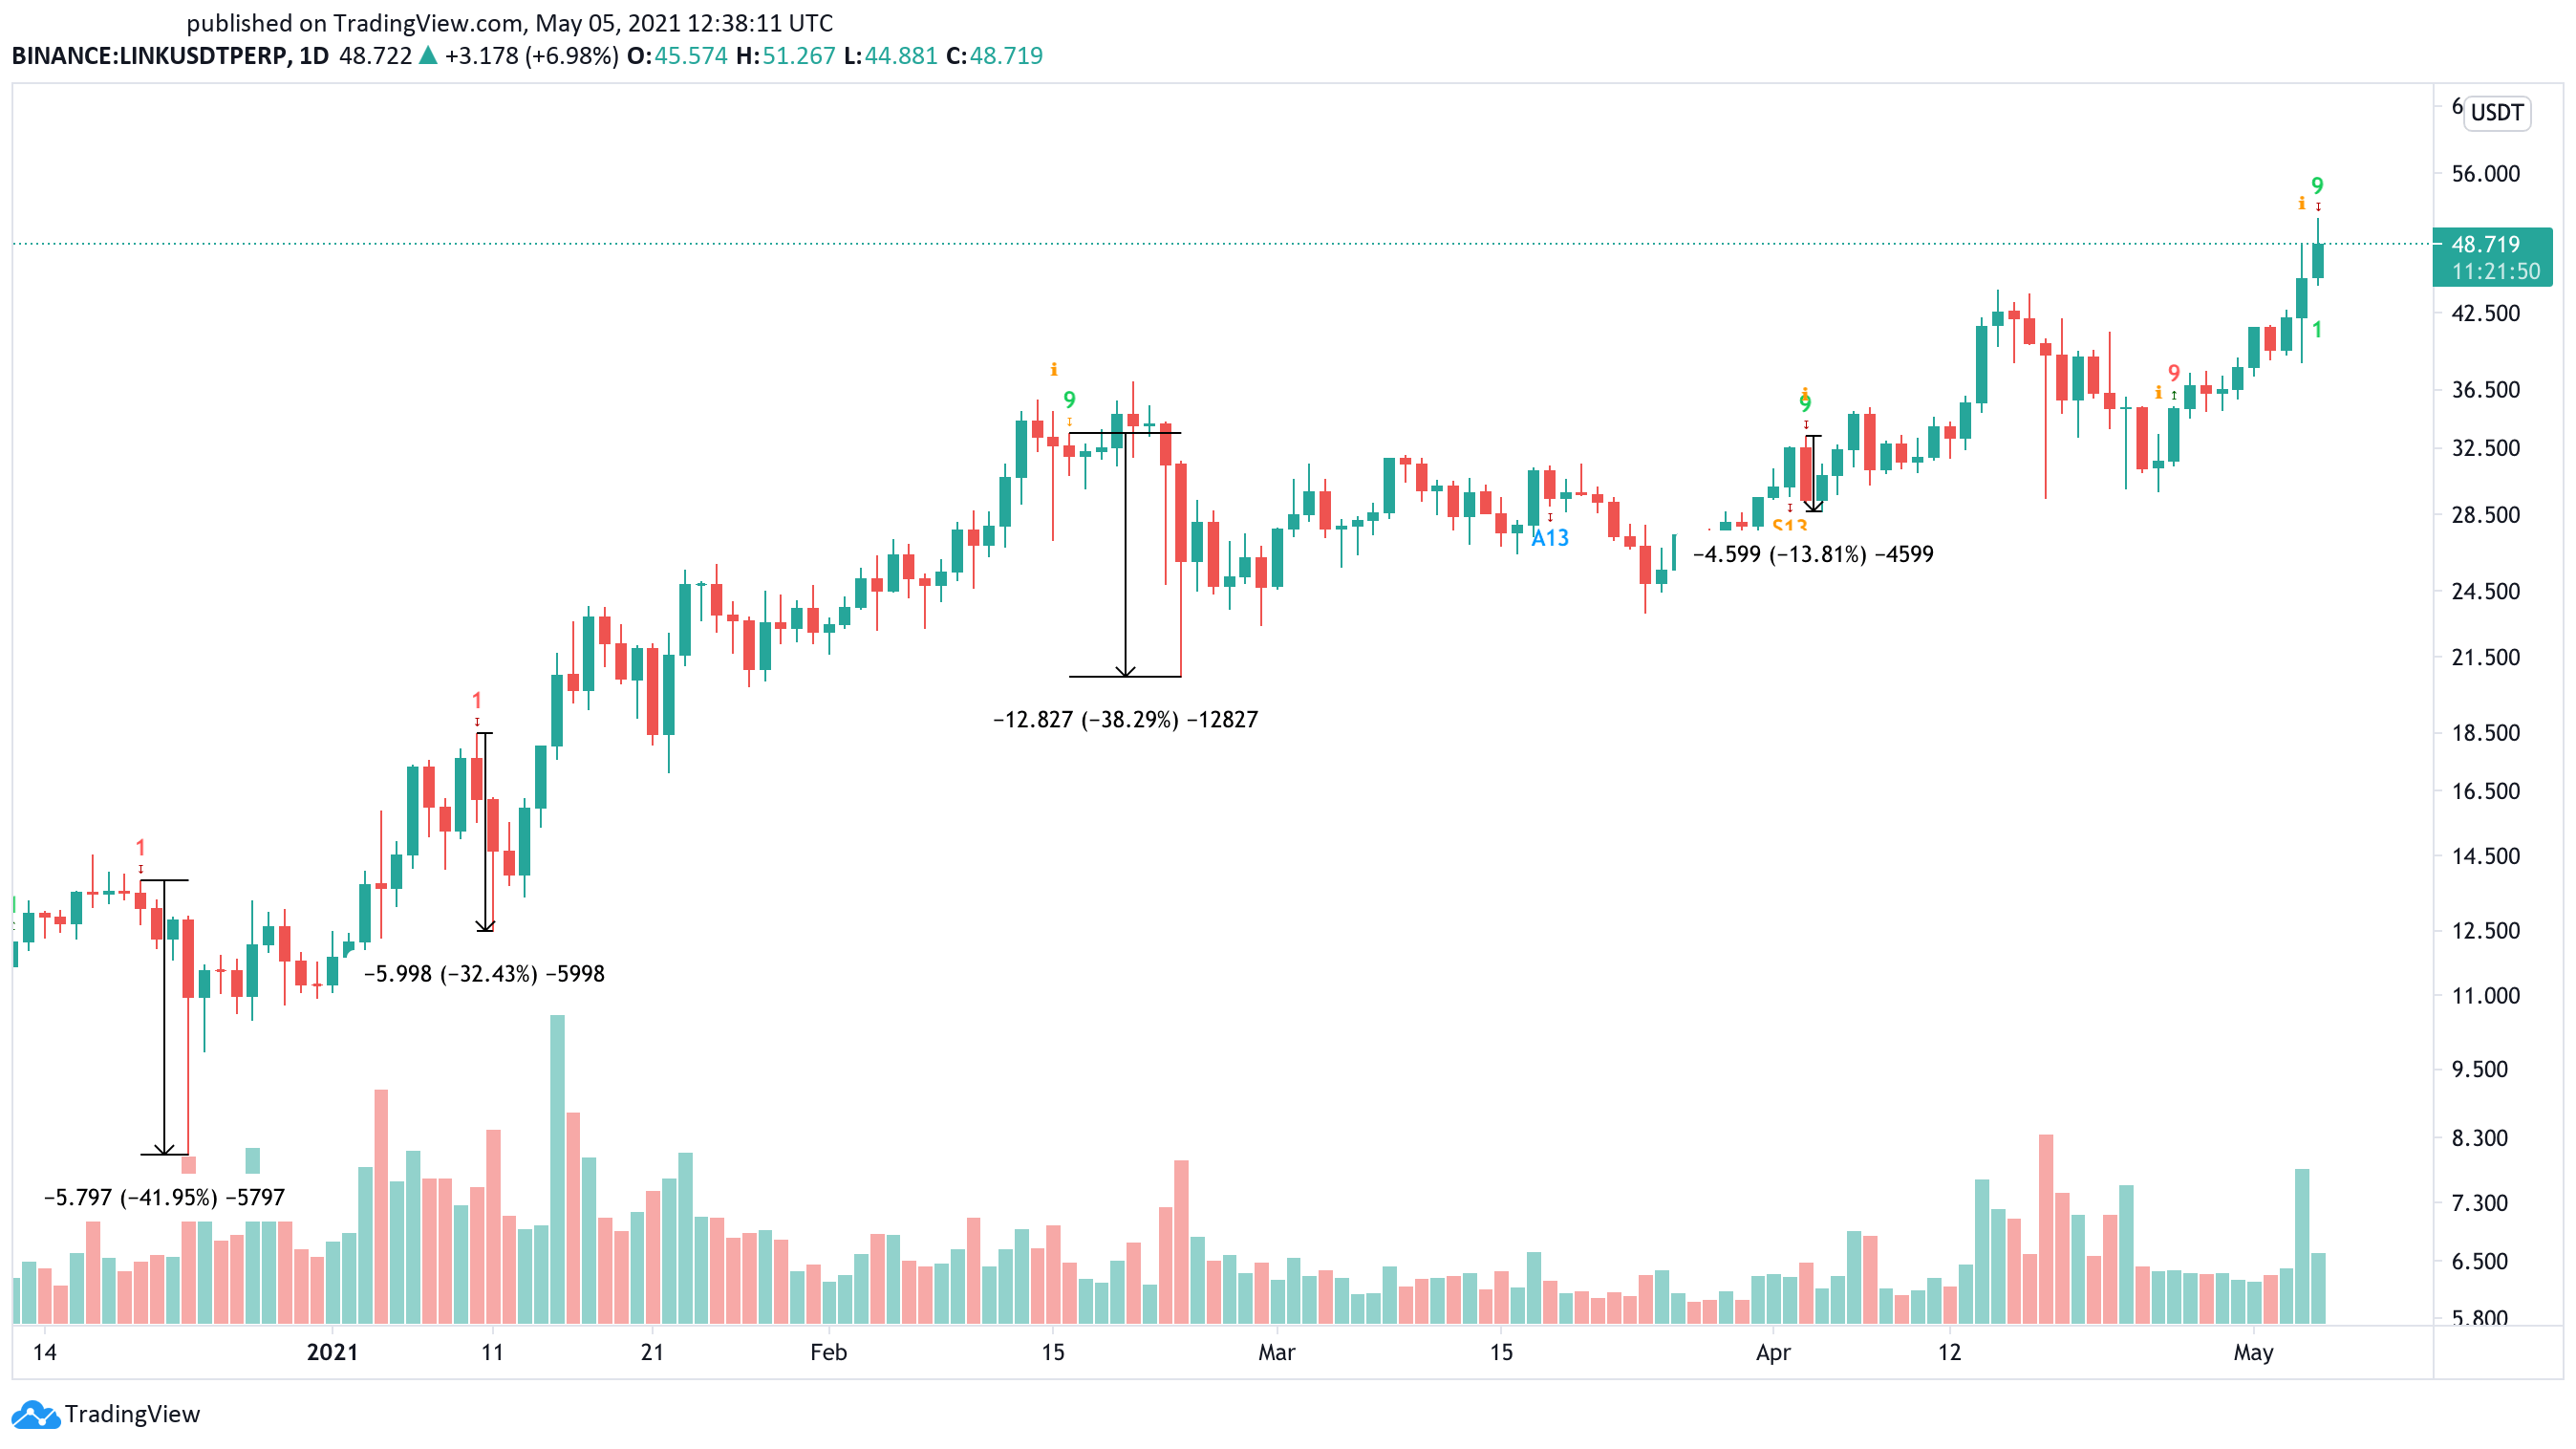
LINK/USDt 1-day chart
IntoTheBlock’s “Global In/Out of the Money” (GIOM) model estimates that the $32.80-$43.70 plays a crucial role in Chainlink’s trend.
Transaction history shows that this is the most significant demand barrier underneath the decentralized oracles token that could hold falling prices at bay. Here, over 76,400 addresses had previously purchased more than 64.25 million LINK. This area could absorb some of the selling pressure from a fall, preventing Chainlink price from falling further.
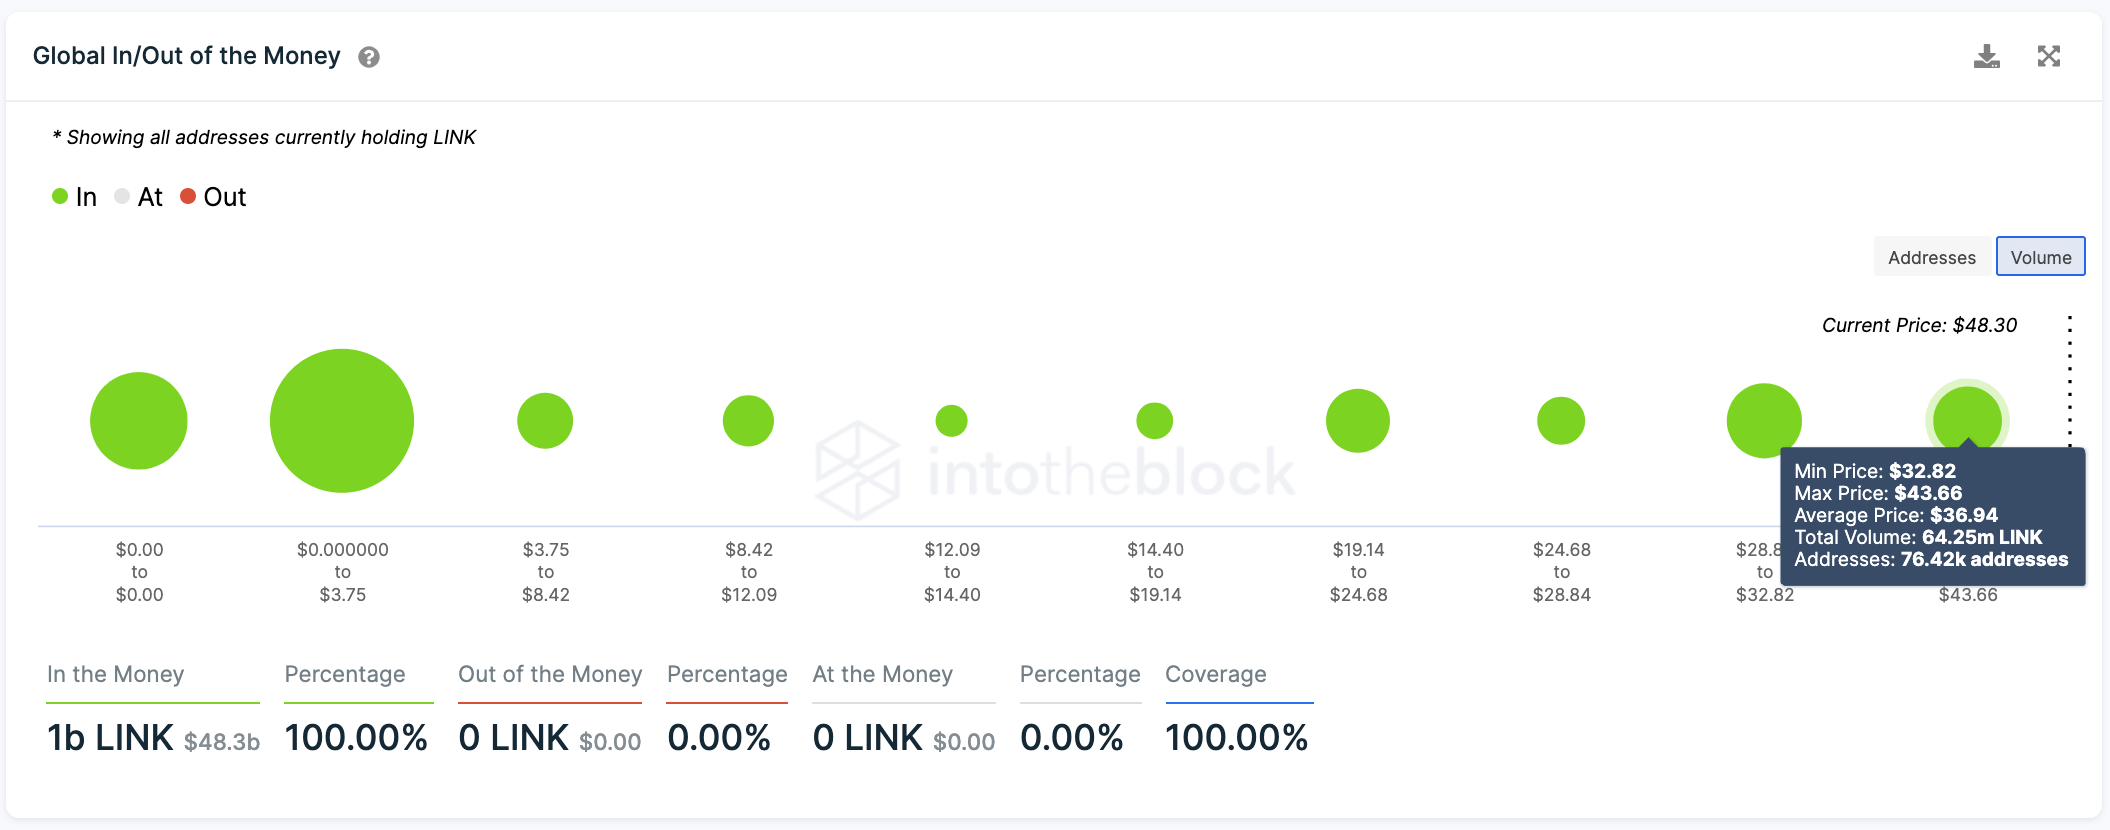
GIOM chart
That said, if this support level breaks, then it could be catastrophic for those betting on the upside. The GIOM cohorts show that the next significant supply level reinforcing Chainlink’s uptrend sits around $30.
If the $36.90 support were to break, LINK holders should expect their investments to plunge by another 17%.
Author
FXStreet Team
FXStreet
Composed of a group of economic journalists and FX experts, the FXStreet content team produces and oversees all content published on FXStreet. It provides a purely journalistic approach to the Forex market.


