Chainlink Price Prediction: LINK could lift off to a new all-time high
- Chainlink is nearing a potentially massive breakout pointing to highs above $40.
- The IOMAP chart reveals a stronger on-chain front based on the immediate robust support.
- Closing the day under $30 may delay the upswing, forcing Chainlink to retest support at $27.
-637336005550289133.jpg)
Chainlink is consolidating after it hit a barrier marginally under $32. The sideways price action means the bullish and bearish momentum is canceling out. However, LINK appears to have a bullish impulse, based on the short-term analysis.
Chainlink steadies for a 36% move
The 4-hour chart has printed a vivid ascending triangle. This pattern is regarded as bullish and forms after a significant price movement followed by consolidation. A horizontal line connects the relatively equal peaks while an ascending trendline links the higher lows.
A breakout is usually anticipated as the triangle matures. Ascending triangle patterns hint at a colossal but precise breakout target, measured from the highest to the lowest points. For instance, the chart shows that Chainlink may swing higher by 36% and trade a new record high around $44.
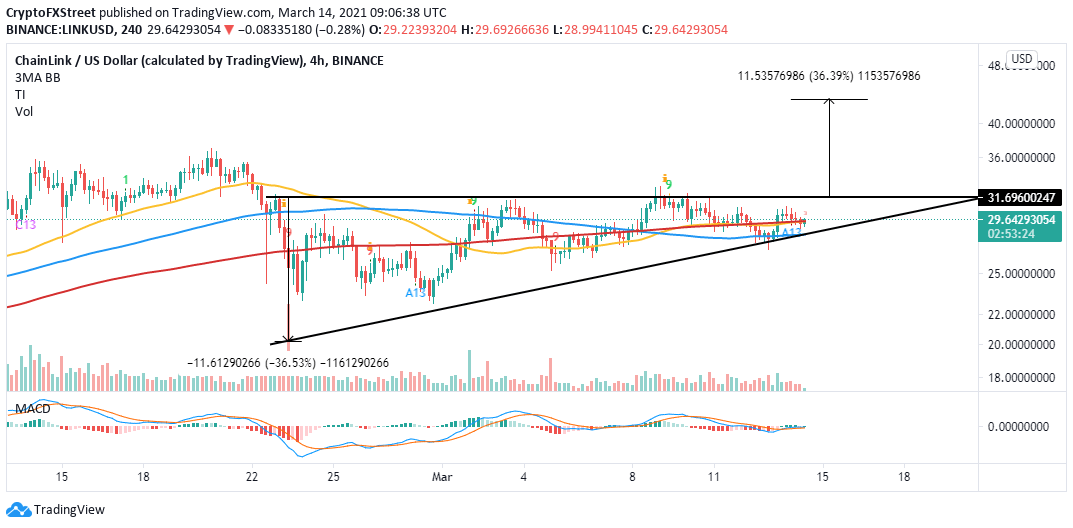
LINK/USD 4-hour chart
Chainlink must hold above the 50 Simple Moving Average (SMA) and the 200 SMA on the 4-hour chart to sustain the uptrend. Similarly, the Moving Average Convergence Divergence (MACD) confirms the uptrend as it moves closer to crossing into the positive territory.
The IOMAP model firmly reinforces the uptrend by revealing the absence of robust resistance. In other words, a breakout has the potential of becoming massively bullish and pave the way for gains above $40.
On the downside, the model brings to light immense resistance zones. For instance, the region running from $29 to $30. Here, nearly 20,600 addresses had previously bought around 50.4 million LINK. Other support zones are massive but not as robust; thus, the least resistance path is upwards.
-637513124731665000.png)
Chainlink IOMAP chart
Looking at the other side of the picture
Declines will come back into the picture if LINK closes the day below the confluence formed by the 50 SMA and the 200 SMA on the 4-hour chart. Besides, these losses will be confirmed if the MACD fails to make any considerable move above the mean line. On the downside, massive losses will occur if the price slices through the lower trendline.
Author

John Isige
FXStreet
John Isige is a seasoned cryptocurrency journalist and markets analyst committed to delivering high-quality, actionable insights tailored to traders, investors, and crypto enthusiasts. He enjoys deep dives into emerging Web3 tren


